
Image
|
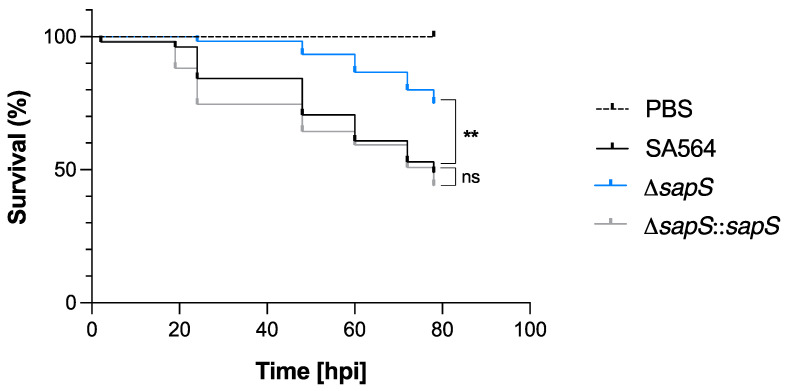
Figure Caption
Figure 3
Infected zebrafish embryos display an increased level of survival when infected with the SA564 ΔsapS mutant. Kaplan–Meier graphic represents the survival of infected zebrafish embryos after injection in the duct of Cuvier with SA564 (black symbols), SA564 ΔsapS (blue symbols), and SA564 ΔsapS::sapS (grey symbols) strains at 3 × 10² CFU/nL grown in exponential phase, or PBS (negative control) The proportion of surviving embryos (n = 50 for each, indicative of three different experiments) is represented. **, p < 0.01, ns, not significant (Log-rank Mantel–Cox statistical test). hpi, hours post-infection.
Figure Data
Acknowledgments
This image is the copyrighted work of the attributed author or publisher, and
ZFIN has permission only to display this image to its users.
Additional permissions should be obtained from the applicable author or publisher of the image.
Full text @ Int. J. Mol. Sci.