
- Title
-
Shoc2 controls ERK1/2-driven neural crest development by balancing components of the extracellular matrix
- Authors
- Norcross, R.G., Abdelmoti, L., Rouchka, E.C., Andreeva, K., Tussey, O., Landestoy, D., Galperin, E.
- Source
- Full text @ Dev. Biol.
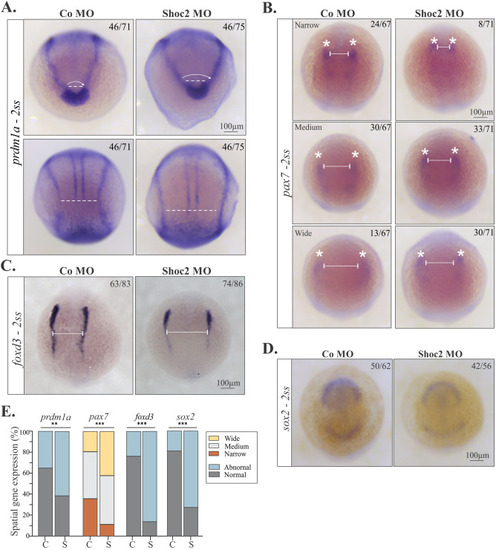
Analysis of gene expression at NPB of shoc2 morphants. Dorsal views of control and shoc2 morphant embryos showing expression of prdm1a (A), pax7 (B), foxd3 (C), and sox2 (D) in 2-somite-stage embryos. Aberrant expression patterns of prdm1a, pax7, foxd3, and sox2 are evident in shoc2 morphants. Lines indicate parameters that were assessed to determine the abnormal expression patterns. Average distances of ∼109 μm (A, top panel), ∼304 μm (A, bottom panel), and ∼275 μm (C) were designated as “normal” expression patterns, while average distances of ∼149 μm (A, top panel), ∼474 μm (A, bottom panel), ∼325 μm (C) designated as “abnormal” expression patterns. In B, the expression patterns are designated as follows: narrow ∼187 μm, medium ∼254 μm, wide ∼355 μm. The graph (E) shows the frequency of observed patterns from at least three independent experiments, C- control morphants, S- Shoc2 morphants. The total number of embryos is indicated on each image. Statistically significant differences between shoc2 MO and control MO according to the Pearson’s chi-squared test are indicated by ∗p<0.05, ∗∗p<0.01, ∗∗∗p<0.001. |
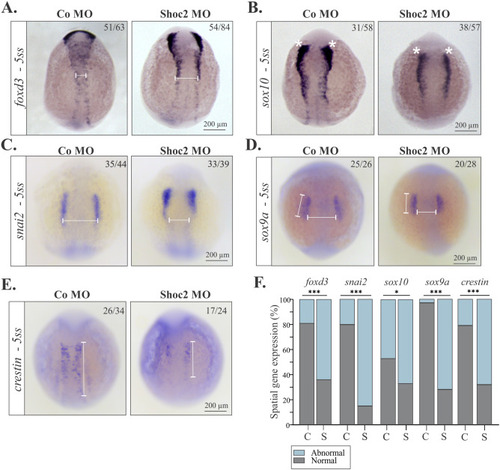
Molecular defects in NC specification in shoc2 morphants. Dorsal views of control and shoc2 morphant embryos show expression of NC specifiers foxd3 (A), sox10 (B), snai2 (C), sox9a (D) and crestin (E) in 5-somite-stage embryos. White lines and asterisks indicate the parameters that were assessed to determine the changes in expression of foxd3, sox10, snai1, sox9a and crestin. Average distances of ∼92 μm (A), ∼279 μm (C), ∼193 μm (D, vertical) and ∼193 μm (D, horizontal), and ∼455 μm (E) were designated as “normal” expression patterns, while average distances of ∼167 μm (A), ∼174 μm (C), ∼157 μm (D, vertical) and ∼198 μm (D, horizontal), and ∼194 μm (E) designated as “abnormal” expression patterns. The graph (F) shows the frequency of observed expression patterns from at least three independent experiments, C- control morphants, S- Shoc2 morphants. The total number of embryos used in the statistical analysis is indicated on each image. Statistically significant differences between shoc2 MO and control MO according to the Pearson’s chi-squared test are indicated by ∗p<0.05, ∗∗p<0.01, ∗∗∗p<0.001. |
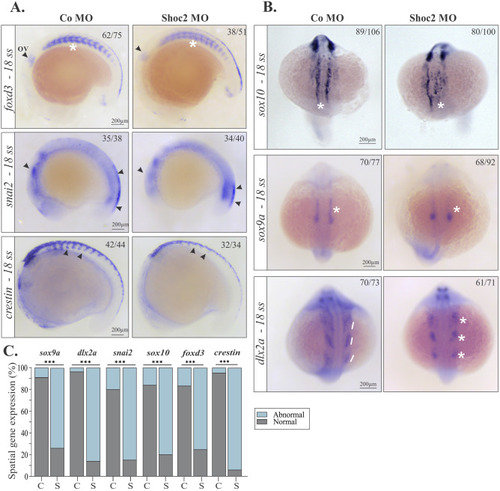
Gene expression abnormalities in early migrating NCCs in shoc2 morphants. Lateral views of control and shoc2 morphant embryos showing expression of (A) foxd3, snai2, and crestin at the 18-somite stage. Arrows show the delayed neural crest migration (B) Dorsal views of control and shoc2 morphant embryos showing expression of sox10, sox9a, and dlx2a. Asterisks and lines emphasize changes in expression patterns observed in shoc2 morphants. Arrows, asterisks, and lines also indicate the parameters assessed to determine “normal” and “abnormal” phenotypes. The graph (C) shows the frequency of observed abnormal patterns after injection of shoc2 MO or a control MO from at least three independent experiments, C- control morphants, S- Shoc2 morphants. The total number of embryos assessed is indicated in each image. Statistically significant differences between shoc2 MO and control MO according to the Pearson’s chi-squared test are indicated by ∗p<0.05, ∗∗p<0.01, ∗∗∗p<0.001. ov: otic vesicle. |
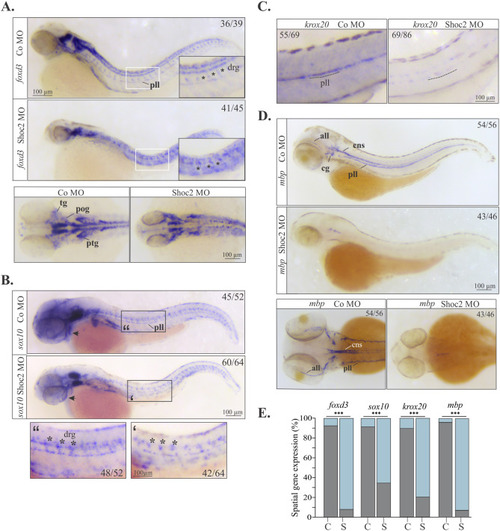
Molecular defects in NC specification and differentiation in shoc2 morphants. Lateral and dorsal views of control and shoc2 morphant larvae. Lateral views show decreased expression of foxd3 (A) and sox10 (B) at 2 dpf and krox20 (C) at 3 dpf of shoc2 morphant larvae along the lateral midline (insets) and cranial area (arrows). (D) Lateral and dorsal views show a dramatic reduction in expression of mbp in shoc2 morphants at 3 dpf. Arrows, asterisks, and lines indicate the parameters assessed to compare the expression patterns and determine “normal” and “abnormal” phenotypes. The graph (E) shows the frequency of abnormal patterns from at least three independent experiments, C- control morphants, S- Shoc2 morphants. The total number of embryos assessed is indicated in each image. Statistically significant differences between shoc2 MO and control MO according to the Pearson’s chi-squared test are indicated by ∗p<0.05, ∗∗p<0.01, ∗∗∗p<0.001. all: anterior lateral line. cns: central nervous system. pll: posterior lateral line. cg:cranial ganglia. drg: dorsal root ganglia. pog: preotic ganglia; ptg: postotic ganglia; tg: trigeminal ganglia. |
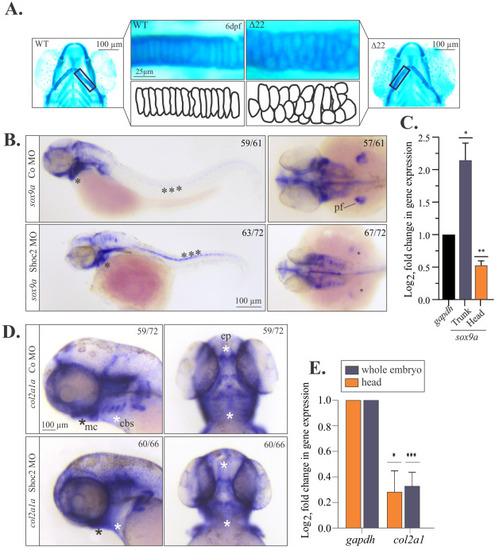
Molecular defects in craniofacial development and chondrocyte morphology in Shoc2 depleted embryos. (A) Flat mounts of WT and shoc2(Δ22) mutant 6 dpf larvae stained with Alcian blue. The lower panels show individual chondrocytes outlined in black, highlighting the differences in cell morphology of the ceratohyal cartilage. (B) Lateral and dorsal views of control and shoc2 morphant larvae show the sox9a expression of 2 dpf larvae. Asterisks show areas of altered sox9a expression in the control and shoc2 morphants. (C) Total RNA was extracted from the dissected trunk of 3 dpf control and shoc2 morphant larvae. The levels of sox9a mRNA expression were quantified by qPCR. gapdh is a control mRNA. The data are presented as the Log2fold change of the mRNA levels in morphant larvae normalized to control. The results represent an average of three biological replicas. Error bars indicate means with SEM. ∗p<0.05, ∗∗p<0.01, ∗∗∗p<0.001 (Student’s t-test). (D) Lateral and dorsal views of control and shoc2 morphant embryos show the col2a1 expression in 3 dpf larvae. Asterisks mark areas of reduced col2a1 expression in shoc2 morphants. (E) Total RNA was extracted from dissected 3 dpf control and Shoc2 morphant larvae and levels of col2a1 mRNA expression were quantified by qPCR. The data are presented as the Log2fold change of the mRNA levels in morphant larvae normalized to control. gapdh is a control mRNA. The results represent an average of three biological replicas. Error bars indicate means with SEM. ∗p<0.05, ∗∗p<0.01, ∗∗∗p<0.001 (Student’s t-test). pf: pectoral fin. mc: Meckel’s cartilage. cbs: ceratobranchials. ep: ethmoid plate. |
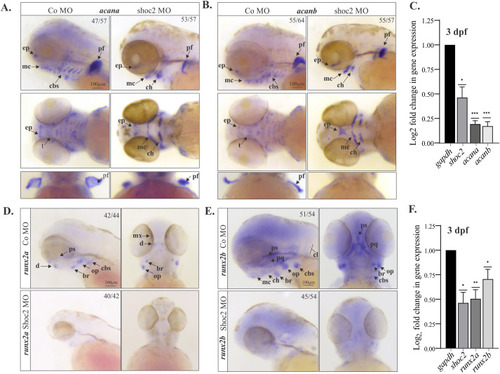
Extracellular matrix and bone pre-cursor genes are deficient in craniofacial cartilage and bone structures in shoc2 morphants. Lateral and ventral views of control and shoc2 morphant embryos show expression of the extracellular matrix proteoglycan acana (A) and acanb (B) at 3 dpf. Arrows indicate sites of reduced or lost expression. The total number of embryos used in the statistical analysis is indicated on each image. (C) Total RNA was extracted from control and Shoc2 morphant larvae at 3 dpf and levels of shoc2, acana and acanb mRNA expression were quantified by qPCR. gapdh is a control mRNA. The data are presented as the Log2fold change of the mRNA levels in morphant larvae normalized to control. The results represent an average of three biological replicas. Error bars indicate means with SEM. ∗p<0.05, ∗∗p<0.01, ∗∗∗p<0.001 (Student’s t-test). Lateral and ventral views of control and shoc2 morphant embryos show expression of the runx2a (D) and runx2b (E) at 3 dpf Arrows indicate sites of reduced or lost expression. The total number of embryos used in the statistical analysis is indicated on each image. (F) Total RNA was extracted from control and shoc2 morphant larvae at 3 dpf and levels of shoc2, runx2a and runx2b mRNA expression were quantified by qPCR. gapdh is a control mRNA. The results represent an average of three biological replicas. The data are presented as Log2fold change of the mRNA levels in morphant larvae normalized to control. Error bars indicate means with SEM. ∗p<0.05, ∗∗p<0.01, ∗∗∗p<0.001 (Student’s t-test). ep: ethmoid plate. mc: Meckel’s cartilage. cbs: ceratobranchials. pf: pectoral fin. t: trabeculae. d: dentary. ps: parasphenoid. br: branchiostegal ray. op: opercle. mx: maxilla. pq: palatoquadreate. cl: cleithrum. ch: ceratohyal. |
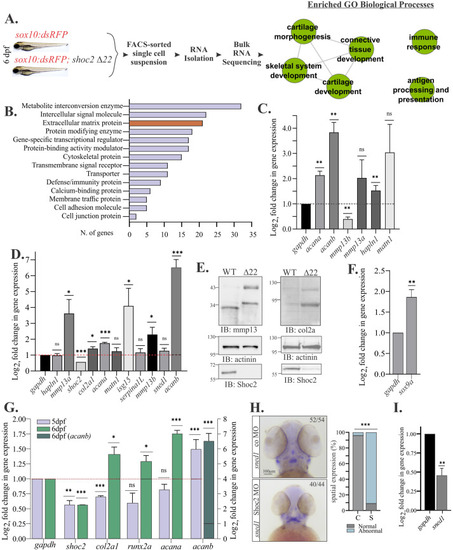
Shoc2 knock-out disrupts gene expression of the sox10-positive cells. (A) Cartoon illustrating the workflow used to analyze transcriptome of sox10: RFP + cells. Total RNA was isolated from the FACS-sorted sox10: RFP + cells, followed by RNA-seq analysis. Data was profiled to identify Enriched GO Biological Processes from Category Compare (Flight et al., 2014). Nodes represent enriched annotation of DEGs. Edges represent relationship between annotation sharing high number of genes with p-value cutoff 0.001 and edge weight greater than 0.90. (B) The top 15 protein classes of 351 differentially expressed genes (FDR≤ 0.05) analyzed with PANTHER pathway analysis. (C) DEGs were selected from the protein class of “Extracellular matrix proteins”. Total RNA was extracted from sox10:dsRed + cells of control and shoc2 null larvae at 6 dpf and mRNA expression were quantified by qPCR. gapdh is a control mRNA. The results represent an average of three biological replicas. The data are presented as the Log2fold change of the mRNA levels in the shoc2 null larvae normalized to WT larvae. Error bars indicate means with SEM. ∗p<0.05, ∗∗p<0.01, ∗∗∗p<0.001 (Student’s t-test). (D.) DEGs were selected from the protein class of Extracellular Matrix Proteins. Total RNA extracted from sox10:dsRed + control and shoc2 null larvae at 6 dpf and levels mRNA expression were quantified by qPCR. The data are presented as the Log2fold change of the mRNA levels in the shoc2 null larvae normalized to WT larvae. gapdh is a control mRNA. The results represent an average of three biological replicas. Error bars indicate means with SEM. ∗p<0.05, ∗∗p<0.01, ∗∗∗p<0.001 (Student’s t-test). (E) Control and shoc2 null larvae were harvested for immunoblotting at 6 dpf. The expression of indicated proteins was analyzed using specific antibodies by WB. (F.) Total RNA extracted from the dissected trunk of WT and shoc2 null larvae at 6 dpf. mRNA expression of sox9a was quantified by qPCR at 6dpf. The data are presented as the Log2fold change of the mRNA levels in the shoc2 null larvae normalized to WT larvae. Gapdh is a control mRNA. The results represent an average of three biological replicas. Error bars indicate means with SEM. ∗p<0.05, ∗∗p<0.01 (Student’s t-test). (G) Total RNA extracted from control and shoc2 null larvae. mRNA expression was quantified by qPCR at 5 or 6 dpf. The data are presented as the Log2fold change of the mRNA levels in the shoc2 null larvae normalized to WT larvae. Gapdh is a control mRNA. The results represent an average of three biological replicas. Error bars indicate means with SEM. ∗p<0.05, ∗∗p<0.01 (Student’s t-test). (H) Ventral view of WT and shoc2 morphant embryos showing expression of sned1 in 3 dpf larvae. Aberrant expression patterns of sned1 are evident in shoc2 morphants. The graph shows the frequency of abnormal patterns. The total number of embryos used in the statistical analysis is indicated. The results represent an average of three biological replicas. Statistically significant differences between shoc2 MO and control MO according to the Pearson’s chi-squared test are indicated by ∗p<0.05, ∗∗p<0.01, ∗∗∗p<0.001. (I) Total RNA was extracted from control and shoc2 null larvae at 6 dpf. The levels of sned1 mRNA expression were quantified by qPCR at 5 and 6 dpf. The data are presented as the Log2fold change of the mRNA levels in the shoc2 morphant larvae normalized to control larvae. gapdh is a control mRNA. The results represent an average of three biological replicas. Error bars indicate means with SEM. ∗p<0.05, ∗∗p<0.01 (Student’s t-test). |
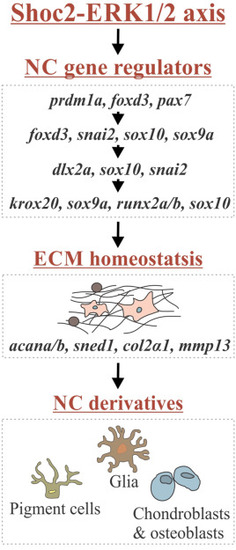
Schematic diagram showing the working model depicting what is currently understood for the role of Shoc2 embryonic development. Shoc2 amplifies and modulates ERK1/2 signaling during early stages of NC development. Shoc2 loss alters expression of key transcription factors essential for NCCs specification, migration and differentiation. Defects in early stages of NC development lead to aberrant expression of downstream effector genes, including proteins regulating homeostasis and remodeling of ECM, ultimately leading to the profound defects in multiple NCC derivatives. |
Reprinted from Developmental Biology, 492, Norcross, R.G., Abdelmoti, L., Rouchka, E.C., Andreeva, K., Tussey, O., Landestoy, D., Galperin, E., Shoc2 controls ERK1/2-driven neural crest development by balancing components of the extracellular matrix, 156-171, Copyright (2022) with permission from Elsevier. Full text @ Dev. Biol.