
|
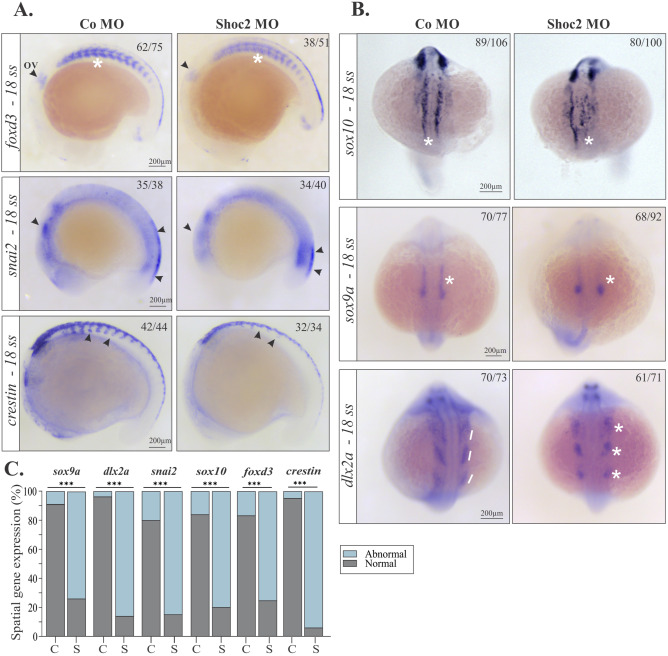
Fig. 3 Gene expression abnormalities in early migrating NCCs in shoc2 morphants.
Lateral views of control and shoc2 morphant embryos showing expression of (A) foxd3, snai2, and crestin at the 18-somite stage. Arrows show the delayed neural crest migration (B) Dorsal views of control and shoc2 morphant embryos showing expression of sox10, sox9a, and dlx2a. Asterisks and lines emphasize changes in expression patterns observed in shoc2 morphants. Arrows, asterisks, and lines also indicate the parameters assessed to determine “normal” and “abnormal” phenotypes. The graph (C) shows the frequency of observed abnormal patterns after injection of shoc2 MO or a control MO from at least three independent experiments, C- control morphants, S- Shoc2 morphants. The total number of embryos assessed is indicated in each image. Statistically significant differences between shoc2 MO and control MO according to the Pearson’s chi-squared test are indicated by ∗p<0.05, ∗∗p<0.01, ∗∗∗p<0.001. ov: otic vesicle.
Reprinted from Developmental Biology, 492, Norcross, R.G., Abdelmoti, L., Rouchka, E.C., Andreeva, K., Tussey, O., Landestoy, D., Galperin, E., Shoc2 controls ERK1/2-driven neural crest development by balancing components of the extracellular matrix, 156-171, Copyright (2022) with permission from Elsevier. Full text @ Dev. Biol.