
|
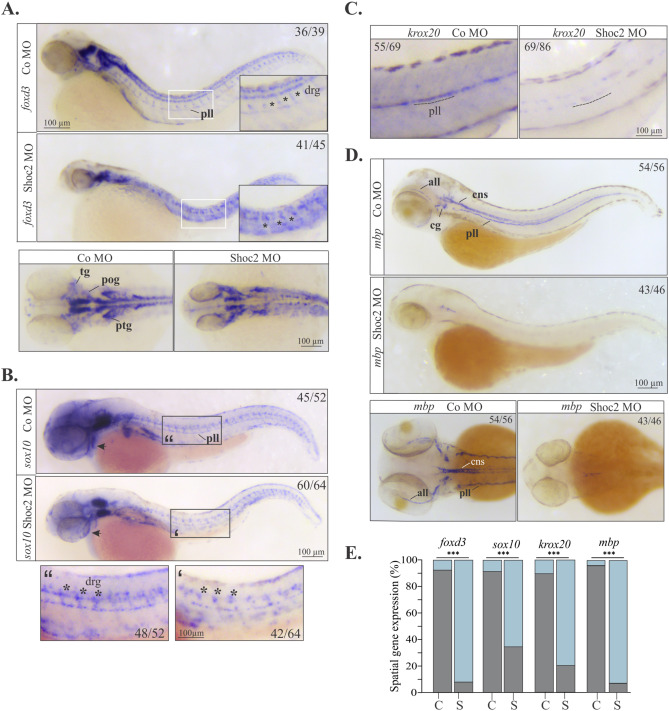
Fig. 4 Molecular defects in NC specification and differentiation in shoc2 morphants.
Lateral and dorsal views of control and shoc2 morphant larvae. Lateral views show decreased expression of foxd3 (A) and sox10 (B) at 2 dpf and krox20 (C) at 3 dpf of shoc2 morphant larvae along the lateral midline (insets) and cranial area (arrows). (D) Lateral and dorsal views show a dramatic reduction in expression of mbp in shoc2 morphants at 3 dpf. Arrows, asterisks, and lines indicate the parameters assessed to compare the expression patterns and determine “normal” and “abnormal” phenotypes. The graph (E) shows the frequency of abnormal patterns from at least three independent experiments, C- control morphants, S- Shoc2 morphants. The total number of embryos assessed is indicated in each image. Statistically significant differences between shoc2 MO and control MO according to the Pearson’s chi-squared test are indicated by ∗p<0.05, ∗∗p<0.01, ∗∗∗p<0.001. all: anterior lateral line. cns: central nervous system. pll: posterior lateral line. cg:cranial ganglia. drg: dorsal root ganglia. pog: preotic ganglia; ptg: postotic ganglia; tg: trigeminal ganglia.
Reprinted from Developmental Biology, 492, Norcross, R.G., Abdelmoti, L., Rouchka, E.C., Andreeva, K., Tussey, O., Landestoy, D., Galperin, E., Shoc2 controls ERK1/2-driven neural crest development by balancing components of the extracellular matrix, 156-171, Copyright (2022) with permission from Elsevier. Full text @ Dev. Biol.