
- Title
-
The ETS transcription factor Spi2 regulates hematopoietic cell development in zebrafish
- Authors
- Zhao, S., Zhang, A., Zhu, H., Wen, Z.
- Source
- Full text @ Development
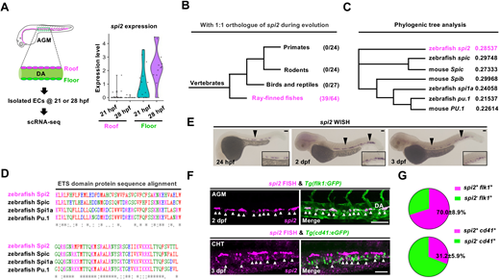
Phylogenic analysis and early expression pattern of spi2. (A) spi2 expression in the roof and floor of the dorsal aorta (DA) at 21 hpf and 28 hpf by scRNA-seq. ECs, endothelial cells. (B) Analysis of spi2 gene ortholog (1:1) during vertebrate evolution. Denominator: the number of analyzed species. Numerator: the number of species containing gene ortholog of spi2. (C) Phylogenic tree analysis of SPI-subfamily in zebrafish and mice. (D) Protein sequence alignment of ETS domain among spi2 paralogs in zebrafish. Asterisks indicate conserved amino acids among spi2 paralogs. (E) spi2 WISH at 24 hpf, 2 dpf and 3 dpf. Black arrowheads show spi2-expressing cells. (F) spi2 FISH and anti-GFP antibody staining in the aorta-gonad-mesonephros (AGM) of Tg(flk1:eGFP) zebrafish (white arrowheads: flk1+spi2+ cells) and in the caudal hematopoietic tissue (CHT) of Tg(cd41:eGFP) zebrafish (white arrowheads: cd41+spi2+ cells). (G) Pie chart shows the quantification percentage (±s.d.) of spi2+flk1+ cells in flk1+ cells in the floor of the DA at 2 dpf (fish n=5) or spi2+cd41+ cells in cd41+ cells in the CHT at 3 dpf (fish n=9) in F. Scale bars: 60 μm. EXPRESSION / LABELING:
|
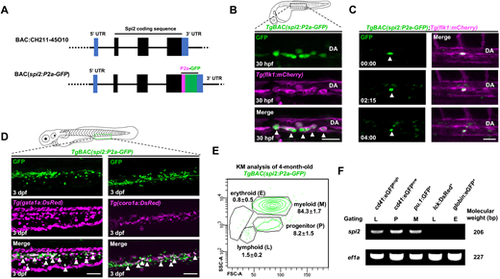
Generation and characterization of TgBAC(spi2:P2a-GFP) zebrafish. (A) Strategy for generating spi2 BAC construct. (B) Images of spi2:GFP expression in the aorta-gonad-mesonephros (AGM) in the TgBAC(spi2:P2a-GFP);Tg(flk1:mCherry) fish at 30 hpf. DA, dorsal aorta. Arrowheads show GFP+mCherry+ cells. (C) Time-lapse imaging frames of TgBAC(spi2:P2a-GFP);Tg(flk1:mCherry) fish indicate an endothelial-to-hematopoietic transition (EHT) event of an spi2-GFP+ cell (white arrowhead) from 30 hpf. (D) Images of the caudal hematopoietic tissue (CHT) in the TgBAC(spi2:P2a-GFP);Tg(gata1a:DsRed) (left) and TgBAC(spi2:P2a-GFP);Tg(coro1a:DsRed) (right) fish at 3 dpf. spi2-GFP+ cells are co-localized with gata1a-DsRed+ (left, white arrowhead) and coro1a-DsRed+ (right, white arrowhead) cells. (E) FACS analysis of the kidney marrow (KM) of adult TgBAC(spi2:P2a-GFP) fish. spi2-GFP+ cells are predominantly found in progenitor- and myeloid-gated populations. (F) qPCR analysis of spi2 expression in FACS-gated populations from WT adult KM. spi2 is enriched in HSPCs (cd41-eGFPlow), myeloid cells (pu.1-GFP+), and thrombocytes (cd41-eGFPhigh). ef1a is used as an internal control. Scale bars: 30 μm (B); 40 μm (C); 60 μm (D). |
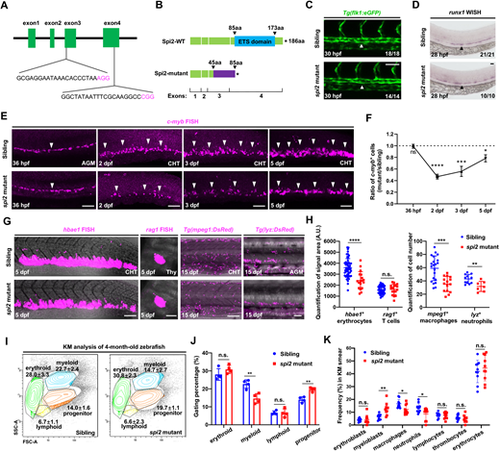
View largeDownload slide spi2 mutants are defective in HSPC maintenance in the CHT and myeloid cells in adulthood. (A) sgRNA design for generating spi2 mutants. (B) The spi2 mutation leads to a 546 bp deletion of the genomic sequences, resulting in generation of a truncated Spi2 protein lacking the ETS domain. (C) Images of flk1-eGFP expression indicating normal dorsal aorta (DA) formation in spi2 mutants. White arrowheads show the vascular structure of the dorsal aorta (DA). (D) runx1 WISH in spi2 mutants and siblings in the aorta-gonad-mesonephros (AGM) at 28 hpf. Black arrowheads show runx1-expressing cells. (E) c-myb FISH in the AGM at 36 hpf and the caudal hematopoietic tissue (CHT) at 2 dpf, 3 dpf and 5 dpf in spi2 mutants and siblings. White arrowheads show c-myb-expressing cells. (F) The ratio of c-myb+ cells (the numbers of c-myb+ cells in the mutants divided by the average number of c-myb+ cells in siblings). Number of siblings or spi2 mutants at 36 hpf, 2, 3 and 5 dpf: 47, 48, 23 and 20, or 18, 18, 10 and 13, respectively. (G,H) Images and quantification of hbae1 FISH, rag1 FISH, anti-mpeg1:DsRed+ staining and anti-lyz:DsRed+ staining in the AGM, CHT or thymus in spi2 mutants and siblings at 5 dpf or 15 dpf. Numbers of siblings or spi2 mutants: 55, 46, 21 and 11, or 18, 17, 15 and 7, respectively. (I,J) FACS analysis and quantification of the percentages of gated lineages in total singlet cells of whole KM in 5-month-old spi2 mutants and siblings (n=4 each). (K) MGG staining quantification of hematopoietic cell types in whole KM smear in 1-year-old spi2 mutants and siblings (n=3 each). Each dot indicates single captured image (n=10 each). n/N reports the number of embryos with staining pattern in image/total embryos. Data are mean±s.d. n.s., P>0.05; *P≤0.05; **P≤0.01; ***P≤0.001; ****P≤0.0001 (Unpaired Student’s t-test). A.U., arbitrary unit. Scale bars: 60 μm. EXPRESSION / LABELING:
|
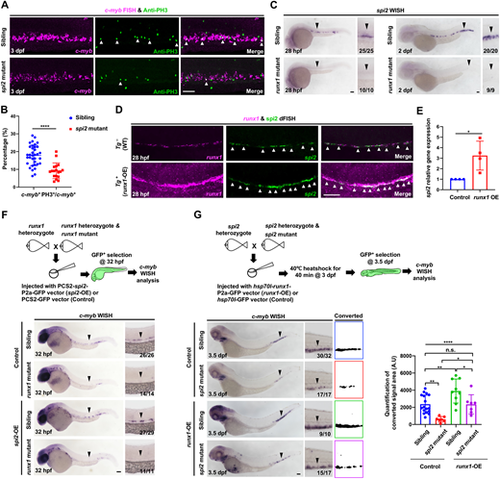
spi2 acts downstream of runx1 and regulates HSPC proliferation in the CHT. (A) Images of c-myb FISH (magenta) and anti-PH3 staining (green) in the caudal hematopoietic tissue (CHT) in spi2 mutants and siblings at 3 dpf. White arrowheads show c-myb+PH3+ cells. (B) The percentage of c-myb+PH3+ cells in the CHT in spi2 mutants (n=18) and siblings (n=35) at 3 dpf in A. (C) WISH of spi2 in the aorta-gonad-mesonephros (AGM) and CHT in runx1W84X mutants and siblings at 28 hpf and 2 dpf. Black arrowheads show spi2-expressing cells. (D) dFISH of runx1 (magenta) and spi2 (green) in the AGM of WT (Tg−) and runx1-overexpressed Tg(flk1:runx1-P2a-GFP) embryos (Tg+: runx1-OE) at 28 hpf. White arrowheads show runx1+spi2+ cells. (E) qPCR analysis of spi2 expression in runx1-OE and control endothelial cells (ECs). runx1-OE, ECs with runx1 overexpression; Control, ECs without runx1 overexpression. (F) c-myb WISH in 32 hpf runx1 mutants and siblings with or without spi2 overexpression. PCS2-spi2-P2a-GFP (spi2-OE) or PCS2-GFP (control) vector was injected into one-cell stage embryos. Black arrowheads show c-myb-expressing cells. (G) c-myb WISH and quantification of c-myb signals in the CHT in spi2 mutants and siblings with (siblings n=17; mutants n=7) or without (siblings n=9; mutants n=7) runx1 overexpression. hsp70l-runx1-P2a-GFP (runx1-OE) or hsp70l-GFP (control) vector was injected into one-cell stage embryos. Heat shock was performed at 3 dpf at 40°C for 40 min. Black arrowheads show c-myb-expressing cells. Data are mean±s.d. n.s., P>0.05; *P≤0.05; **P≤0.01; ****P≤0.0001. (An unpaired Student's t-test was used in B and E. Two-way analysis of variance (ANOVA), followed by Tukey's multiple comparisons tests were used in G.) Scale bars: 60 μm. EXPRESSION / LABELING:
PHENOTYPE:
|