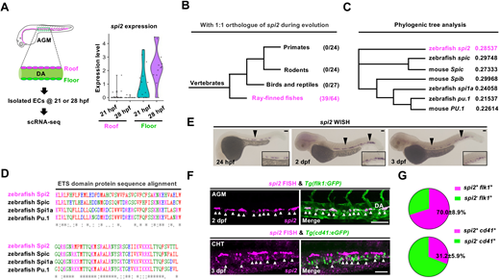
Phylogenic analysis and early expression pattern of spi2. (A) spi2 expression in the roof and floor of the dorsal aorta (DA) at 21 hpf and 28 hpf by scRNA-seq. ECs, endothelial cells. (B) Analysis of spi2 gene ortholog (1:1) during vertebrate evolution. Denominator: the number of analyzed species. Numerator: the number of species containing gene ortholog of spi2. (C) Phylogenic tree analysis of SPI-subfamily in zebrafish and mice. (D) Protein sequence alignment of ETS domain among spi2 paralogs in zebrafish. Asterisks indicate conserved amino acids among spi2 paralogs. (E) spi2 WISH at 24 hpf, 2 dpf and 3 dpf. Black arrowheads show spi2-expressing cells. (F) spi2 FISH and anti-GFP antibody staining in the aorta-gonad-mesonephros (AGM) of Tg(flk1:eGFP) zebrafish (white arrowheads: flk1+spi2+ cells) and in the caudal hematopoietic tissue (CHT) of Tg(cd41:eGFP) zebrafish (white arrowheads: cd41+spi2+ cells). (G) Pie chart shows the quantification percentage (±s.d.) of spi2+flk1+ cells in flk1+ cells in the floor of the DA at 2 dpf (fish n=5) or spi2+cd41+ cells in cd41+ cells in the CHT at 3 dpf (fish n=9) in F. Scale bars: 60 μm.
|
