FIGURE SUMMARY
Title

Involvement of transmembrane protein 184a during angiogenesis in zebrafish embryos

Authors
Field, C.J., Perez, A.M., Samet, T., Ricles, V., Iovine, M.K., Lowe-Krentz, L.J.
Source
Full text @ Front. Physiol.

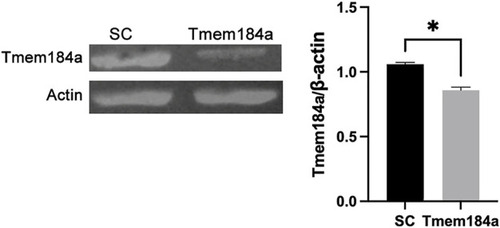
Tmem184a MO Treatment Results in Tmem184a Protein Decrease. Embryos were injected with SC or Tmem184a ATG MO and harvested for western blotting. Three identically treated embryos constituted a single sample. One of three identical experiments is shown with the graph summarizing the data.

EXPRESSION / LABELING:
Gene:
Antibody:
Fish:
Knockdown Reagent:
Anatomical Term:
Stage: Long-pec
PHENOTYPE:
Fish:
Knockdown Reagent:
Observed In:
Stage: Long-pec

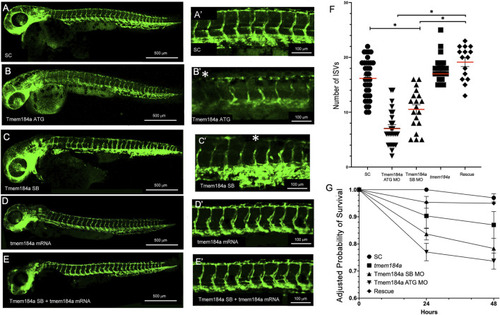
Tmem184a KD Results in Decreased Number of Intact Intersegmental Vessels. (A,A′) SC MO injected embryo (n = 35). (B,B′) Tmem184a SB MO injected embryo (n = 25). (C,C′) Tmem184a ATG MO injected embryo (n = 19). Asterisks indicate ISVs that failed to complete injected embryos. (D,D′) Injection with full-length Tmem184a mRNA alone (n = 21). (E,E′) Co-injection with full-length Tmem184a mRNA rescues vascular defects in Tmem184a SB MO injected embryos (n = 15). (A′–E′) illustrate zoomed trunk regions of the fish. (F). KD by SB and ATG MOs compared to SC MO embryos and rescue embryos with SB MO and Tmem184a mRNA, illustrating the mean number of intact ISVs ± SEM. p < 0.001. (G) Embryo survival for all treatments shown as compared to SC embryo survival at 24 h ± SEM p < 0.001.

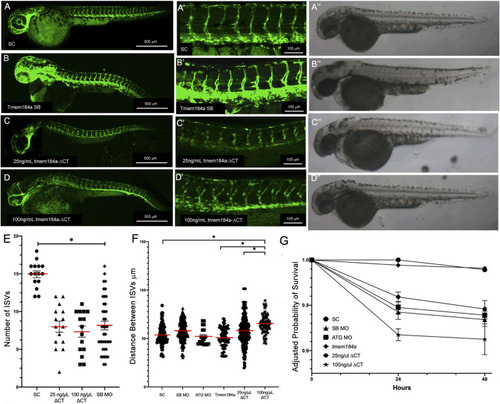
Removing HS binding domains negatively affects Angiogenesis. Embryos were injected with (A,A′) SC MO (n = 20) (C,C′) 25 ng/μL tmem184a ΔCT (n = 60) or (D,D′) 100 ng/µL tmem184a ΔCT (n = 60) and evaluated at 48 hpf as described in Methods. SB results are shown for comparison (B,B′). (A′′–D′′) illustrate brightfield images from identically treated embryos. Graph (E) illustrates the intact ISVs in SC, tmem184a -ΔCT at either concentration. p < 0.001 (F) The distance between ISVs was measured for each treatment using Image J. P < 0.001 (G) Embryo survival for all treatments illustrated relative to 24 h survival of SC embryos.

tmem184a-∆CT mRNA does not rescue knockdown phenotypes. Embryos were injected with (A,A′) SC MO (n = 20) (B,B′) SB MO followed by 25 ng/μL full-length Tmem184a mRNA (n = 60) (C,C′) SB MO (n = 40) (D,D′) SB MO followed by 25 ng/μL tmem184a-ΔCT (n = 60) or (E,E′) SB MO followed by 100 ng/µL tmem184a-ΔCT (n = 60) and evaluated at 48 hpf as described in Methods. (F) The graph illustrates the intact ISVs in SC, rescue (SB MO plus full-length Tmem184a mRNA as in Figure 2) embryos, SB MO plus tmem184a-ΔCT at either concentration. p < 0.001. (G) The distance between ISVs was measured for each treatment using Image J. P < 0.001. (H) Embryo survival for all treatments illustrated relative to 24 h survival of SC embryos.

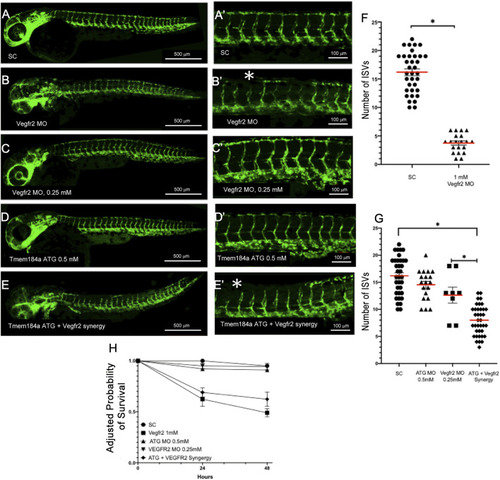
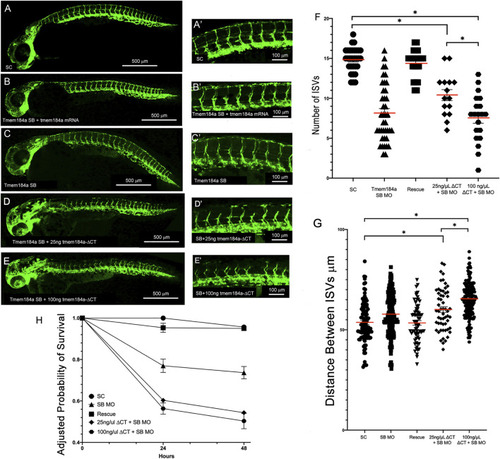
Tmem184a and Vegfr2 Function Synergistically to Modulate Angiogenesis. (A,A′) Standard control MO injected embryos (n = 35). (B,B′) Vegfr2 MO injected embryos (n = 20). Asterisks indicate ISVs that have failed to complete growth. (C,C′) Embryos injected with the subthreshold concentration of the Tmem184a ATG MO (0.50 mM) (n = 14). (D,D′) Embryos injected with the subthreshold concentration of the Vegfr2 MO (0.25 mM) (n = 8). (E,E′) 48 hpf embryos co-injected with both subthreshold concentrations of the Tmem184a ATG and Vegfr2 MOs (n = 37). Asterisks indicate ISVs that failed to complete growth. (F) This graph illustrates the mean number of intact ISVs ± SEM in 1 mm Vegfr2 and SC MOs. p < 0.01. (G) The graph is the mean number of intact ISVs ± SEM in subthreshold injected Tmem184a ATG and Vegfr2 MOs as compared to both subthreshold MOs. p < 0.01. (H) Embryo survival for all treatments illustrated relative to 24 h survival of SC embryos.

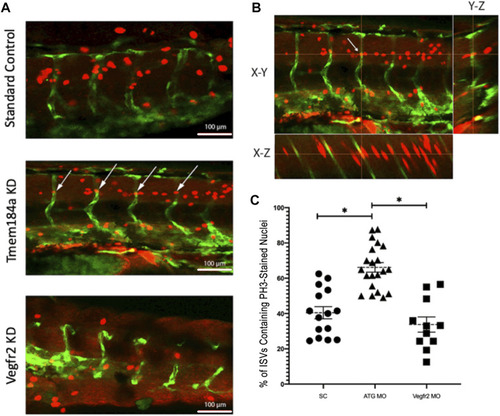
Tmem184a KD Causes an Increase in Cell Proliferation. (A) Example images of PH3 staining in SC, Tmem184a, and Vegfr2 MO knockdown embryos at 48 hpf. White arrows indicate where the PH3 staining co-localizes with the GFP in the vasculature of the ATG MO-treated embryo, highlighted in yellow. Z-stack images were rotated to confirm nuclear PH3 in the EC. Embryos injected with the Tmem184a MO (n = 21) exhibit an increase in the percentage of ISVs that contain an PH3 stained nucleus compared to either SC (n = 21) or Vegfr2 (n = 11) injected embryos. (B) One PH3 nucleus in an ISV is shown in all planes. Cross-hairs intersect at the stained ISV localized nucleus. (C) The graph illustrates the percentage of ISVs per embryo containing an PH3-stained nucleus. p < 0.001.

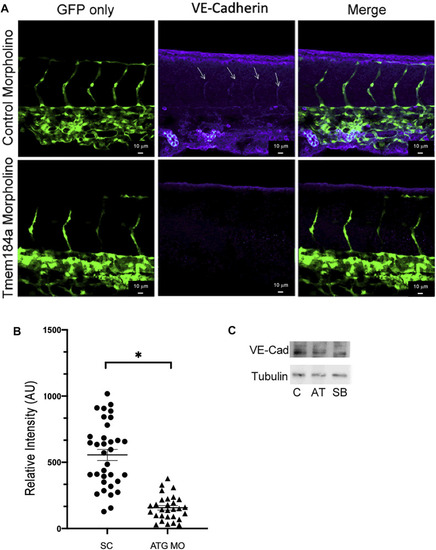
KD of Tmem184a results in decreased levels of VE-cadherin. Embryos were injected with control or ATG-MO for Tmem184a, sorted for GFP positive and fixed at 43 hpf. Embryos were stained with the Anti-zebrafish VE-cadherin antibody as described in Methods and imaged on the Zeiss LSM 880 confocal microscope at 20x. (A) Sections in the mid-section of representative embryos are illustrated. Sections illustrated are maximum intensity images as in Methods. Data from 34 Tmem184a KD ISVs and 29 control ISVs from four embryos of each type were analyzed for VE-cadherin intensity across all ISVs in the mid-sections imaged and a graph illustrating relative VE-cadherin is shown in (B). A student’s T test was used to determine significance, p < 0.001 (C) Western blots of identically treated embryo lysates are shown.

EXPRESSION / LABELING:
Antibody:
Fish:
Knockdown Reagent:
Anatomical Terms:
Stage: High-pec
PHENOTYPE:
Fish:
Knockdown Reagent:
Observed In:
Stage: High-pec

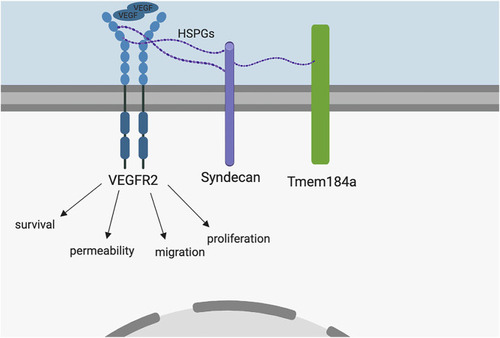
Model. Based on the literature, we hypothesized HS interaction with Tmem184a is involved in modulation of Vegfr2 signal transduction. VEGF binding to Vegfr2 induces a signaling cascade responsible for the EC survival, permeability, migration, and proliferation necessary for angiogenesis. The present study provides evidence supporting this hypothesis.

ZFIN is incorporating published figure images and captions as part of an ongoing project. Figures from some publications have not yet been curated, or are not available for display because of copyright restrictions.

Acknowledgments
This image is the copyrighted work of the attributed author or publisher, and ZFIN has permission only to display this image to its users. Additional permissions should be obtained from the applicable author or publisher of the image. Full text @ Front. Physiol.