IMAGE

FIGURE 5

ID
ZDB-IMAGE-220921-73
Source
Figures for Field et al., 2022
Image
Figure Caption

FIGURE 5

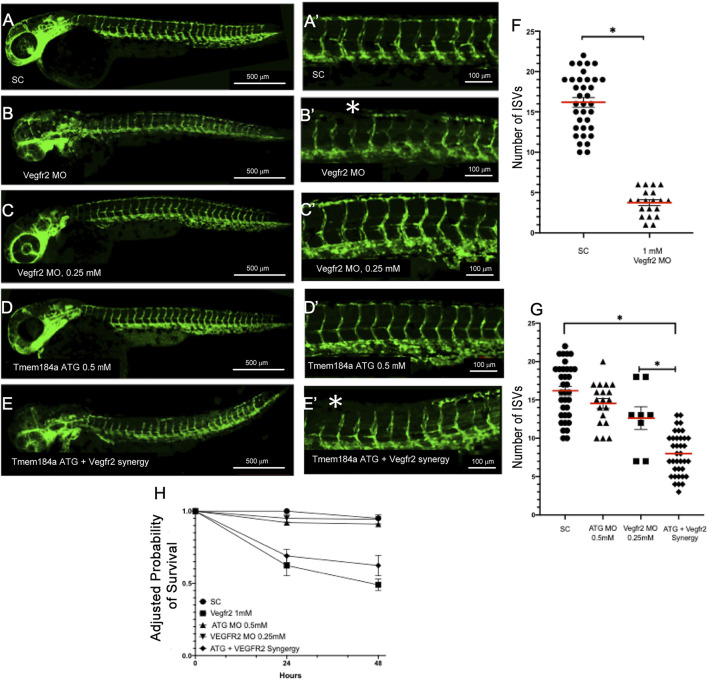
Tmem184a and Vegfr2 Function Synergistically to Modulate Angiogenesis. (A,A′) Standard control MO injected embryos (n = 35). (B,B′) Vegfr2 MO injected embryos (n = 20). Asterisks indicate ISVs that have failed to complete growth. (C,C′) Embryos injected with the subthreshold concentration of the Tmem184a ATG MO (0.50 mM) (n = 14). (D,D′) Embryos injected with the subthreshold concentration of the Vegfr2 MO (0.25 mM) (n = 8). (E,E′) 48 hpf embryos co-injected with both subthreshold concentrations of the Tmem184a ATG and Vegfr2 MOs (n = 37). Asterisks indicate ISVs that failed to complete growth. (F) This graph illustrates the mean number of intact ISVs ± SEM in 1 mm Vegfr2 and SC MOs. p < 0.01. (G) The graph is the mean number of intact ISVs ± SEM in subthreshold injected Tmem184a ATG and Vegfr2 MOs as compared to both subthreshold MOs. p < 0.01. (H) Embryo survival for all treatments illustrated relative to 24 h survival of SC embryos.

Figure Data
Acknowledgments
This image is the copyrighted work of the attributed author or publisher, and ZFIN has permission only to display this image to its users. Additional permissions should be obtained from the applicable author or publisher of the image. Full text @ Front. Physiol.