
- Title
-
A non-polar fraction of Saponaria officinalis L. acted as a TLR4/MD2 complex antagonist and inhibited TLR4/MyD88 signaling in vitro and in vivo
- Authors
- Yu, G.R., Lim, D.W., Karunarathne, W.A.H.M., Kim, G.Y., Kim, H., Kim, J.E., Park, W.H.
- Source
- Full text @ FASEB J.

SH inhibited LPS-induced up-regulations of iNOS and COX-2 and the phosphorylation of MAPKs in THP-1 macrophages. (A) THP-1 macrophages produced by treating THP-1 monocytes with PMA, were incubated for 24 h with SH at 0–100 μg/ml. Cell viabilities were determined using an EZ-cytox assay kit. Results are presented as the means ± SDs of percentages determined by three independent experiments versus non-treated controls. (B, C) THP-1 macrophages were co-treated with SH and LPS (1 μg/ml) for 24 h. Relative protein levels of iNOS and COX-2 were determined by western blot. (D, E) Relative gene expression levels of iNOS and COX-2 as determined by Real-time PCR. qPCR data were normalized by dividing Ct values of genes by that of GAPDH. (F) Relative MAPKs expressions as determined by western blot. (G) Band intensities were measured by densitometry and normalized versus the intensities of total forms and β-actin. Results are presented as the means ± SDs of three independent experiments. ##p < .01 versus PMA-treated controls, and *p < .05, **p < .01 versus LPS-treated macrophages.
|

SH suppressed NF-κB translocation by reducing the phosphorylation of IκB-α in THP-1 macrophages. THP-1 macrophages were co-treated with SH and LPS (1 μg/ml) for 12 h. (A) Relative phosphorylation of IκB-α and total protein levels as determined by western blot. (B) Nuclear translocation of NF-κB (p65) as determined by western blot, and (C) visualized by immunofluorescence microscopy. Results are presented as the means ± SDs of three different experiments. ##p < .01 versus non-treated control macrophages, and *p < .05, **p < .01 versus LPS-treated control macrophages.
|
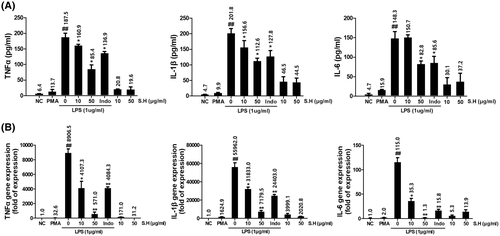
SH reduced LPS-induced increases in pro-inflammatory cytokine levels in THP-1 macrophages. Cells were simultaneously treated with SH and LPS (1 μg/ml) for 24 h. (A) Relative expressions of TNFα, IL-1β, and IL-6 as determined by ELISA. (B) Relative expressions of TNFα, IL-1β, and IL-6 as determined by qPCR. Results are presented as the means ± SDs of three different experiments. ##p < .01 versus non-treated THP-1 macrophages, and *p < .05, **p < .01 versus LPS-treated THP-1 macrophages.
|

fr.1 reduced the pro-inflammatory effects of LPS in THP-1 macrophages. (A) THP-1 macrophages were incubated for 24 h with sub-fractions at 0–20 μg/ml. Cell viabilities were measured using an EZ-cytox assay kit. Results are expressed as percentages of levels in non-treated THP-1 macrophages. (B) Relative expressions of iNOS and COX-2 were analyzed by western blot. Relative gene expression levels of iNOS and COX-2 as determined by Real-time PCR. (C) Relative expressions of MAPKs as determined by western blot. (D) Relative phosphorylation of IκB-α and total protein levels as determined by western blot. The nuclear translocation of NF-κB (p65) was determined by western blot. Results are presented as the means ± SDs of three different experiments. ##p < .01 versus non-treated THP-1 macrophages, and *p < .05, **p < .01 versus LPS-treated THP-1 macrophages.
|

fr.1 inhibited the JAK2/STAT3 pathway by reducing pro-inflammatory cytokine production in THP-1 macrophages and inhibited the expression of genes associated with early M1 polarization induced by co-treatment with LPS and IFN-γ. (A) Relative expressions of TNFα, IL-1β, and IL-6 as determined by ELISA, and relative expressions of TNFα, IL-1β, and IL-6 as determined by qPCR. (B) Relative expressions of phosphorylated JAK2/STAT3 as determined by western blot. Results are presented as the means ± SDs of three independent experiments. ##p < .01 versus non-treated THP-1 macrophages, and *p < .05, **p < .01 versus LPS-treated THP-1 macrophages. (C) Relative expressions of M1 markers, that is, CD38, CD80, CD86, HLA-DR, and CXCL10, as determined by qPCR. Results are presented as the means ± SDs of three different experiments. ##p < .01 versus LPS-treated THP-1 macrophages, and *p < .05, **p < .01 versus IFN-γ and LPS co-treated THP-1 macrophages.
|

HPLC analysis of fr.1 and saponarin. HPLC results for (A) commercial saponarin and (B) fr.1. The retention time of the saponarin standard (100 μg/ml) was 11.60 min and that of the main peak of fr.1 (1 mg/ml) was 11.595 min.
|
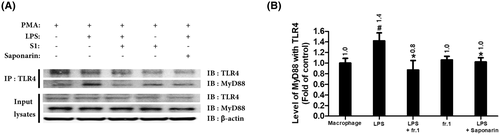
fr.1 and saponarin inhibited the LPS-mediated interaction between TLR4 and MyD88 in THP-1 macrophages. Relative TLR4/MyD88 interactions in LPS-induced macrophages were determined by western blot of immunoprecipitation samples. (A) Western blot images of TLR4-co-immunoprecipitated (Co-IP) protein samples obtained from fr.1 or saponarin treated THP-1 macrophages. Co-IP proteins were detected using TLR4 or MyD88 antibodies. (B) Relative ratios of TLR4 interacting with MyD88 adaptor protein. Band intensities were measured by densitometry and normalized versus TLR4 band intensities. Results are presented as the means ± SDs of three different experiments. #p < .05 versus non-treated control macrophage group, and *p < .05 versus LPS-treated inflammatory macrophage group.
|

fr.1 and saponarin inhibited LPS microinjection-induced abnormality and mortality in zebrafish larvae. (A) Heartbeat rate of zebrafish larvae after LPS injection (0.5 mg/ml) with fr.1 (0–100 μg/ml) treatment. (B) Classification of phenotypes of zebrafish after LPS injection with fr.1. (C) Critical abnormalities morphologically observed under microscopy after LPS injection in fr.1. (D) Heartbeat rate of zebrafish larvae after LPS injection (0.5 mg/ml) with saponarin (0–100 μg/ml) treatment. (E) Classification of phenotypes of zebrafish after LPS injection with saponarin. (F) Critical abnormalities morphologically observed under microscopy after LPS injection in saponarin. ###p < .001 versus negative control larvae, and ***p < .001 versus LPS treated larvae. (n = 20 in each group).
|

fr.1 and saponarin inhibited LPS microinjection-mediated pro-inflammatory cytokines or mediators expression determined by conventional PCR in zebrafish larvae. (A) Relative gene expression of ziNOS, zCOX-2, zTNFα, zIL-6, zIL-1β in LPS-microinjected zebrafish co-treated with fr.1. (B) Relative gene expression of ziNOS, zCOX-2, zTNFα, zIL-6, zIL-1β in LPS-microinjected zebrafish co-treated with saponarin.
|

Molecular docking studies of the interaction between saponarin and TLR4/MD2 complex. (A) Depiction of ligand clusters of saponarin or dexamethasone binding to TLR4/MD2 complex as deduced by protein-ligand docking simulation in Swissdock. (B) Estimated binding energy and pose of the best MD2-ligand binding simulation model. UCSF chimera depicted MD2 protein as a ribbon and provided a surface image. (C) Sidechains of MD2 protein proximal to ligands (within 5 Å) were labeled and visualized by UCSF chimera. (D) 2D image of non-ligand residues and its corresponding atoms of ligand visualized by Ligplot plus.
|