
Image
|
Figure Caption
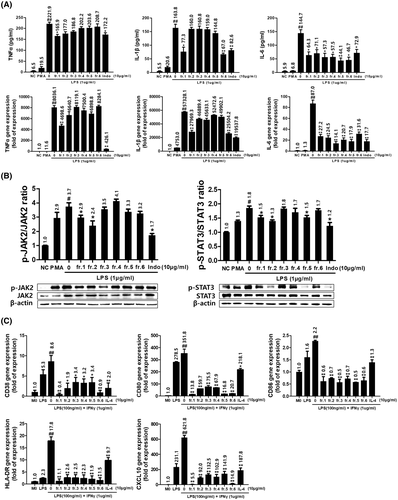
Fig. 5
fr.1 inhibited the JAK2/STAT3 pathway by reducing pro-inflammatory cytokine production in THP-1 macrophages and inhibited the expression of genes associated with early M1 polarization induced by co-treatment with LPS and IFN-γ. (A) Relative expressions of TNFα, IL-1β, and IL-6 as determined by ELISA, and relative expressions of TNFα, IL-1β, and IL-6 as determined by qPCR. (B) Relative expressions of phosphorylated JAK2/STAT3 as determined by western blot. Results are presented as the means ± SDs of three independent experiments. ##p < .01 versus non-treated THP-1 macrophages, and *p < .05, **p < .01 versus LPS-treated THP-1 macrophages. (C) Relative expressions of M1 markers, that is, CD38, CD80, CD86, HLA-DR, and CXCL10, as determined by qPCR. Results are presented as the means ± SDs of three different experiments. ##p < .01 versus LPS-treated THP-1 macrophages, and *p < .05, **p < .01 versus IFN-γ and LPS co-treated THP-1 macrophages.
Acknowledgments
This image is the copyrighted work of the attributed author or publisher, and
ZFIN has permission only to display this image to its users.
Additional permissions should be obtained from the applicable author or publisher of the image.
Full text @ FASEB J.