
- Title
-
Notch-Sox9 Axis Mediates Hepatocyte Dedifferentiation in KrasG12V-Induced Zebrafish Hepatocellular Carcinoma
- Authors
- Sun, J., Chen, Q., Ma, J.
- Source
- Full text @ Int. J. Mol. Sci.
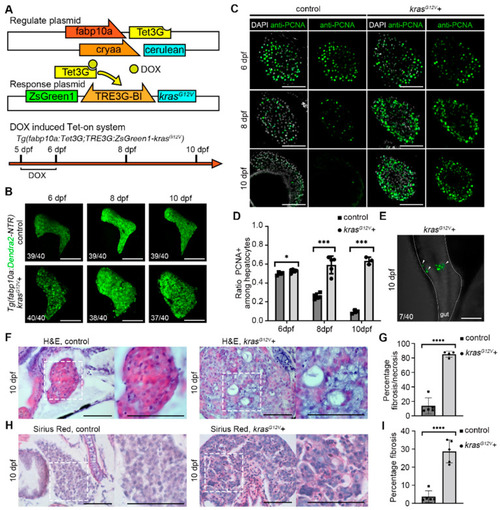
Induction of |
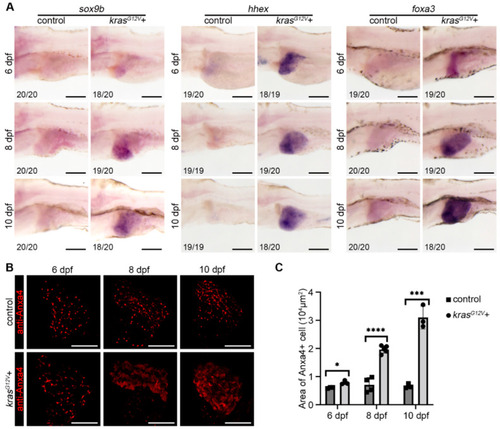
Zebrafish hepatocytes undergo dedifferentiation and biliary duct activation after |

The Notch signaling pathway was upregulated after hepatocellular carcinoma induction, and the inhibition of Notch signaling suppressed hepatocyte dedifferentiation. ( |
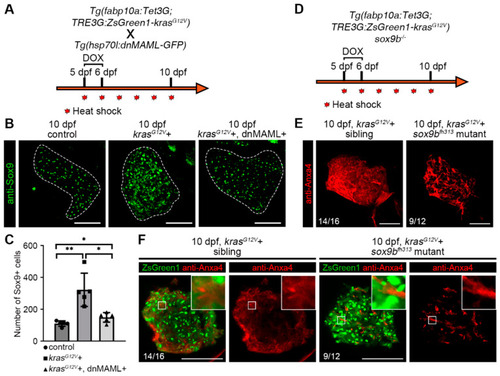
Hepatic Sox9 expression is upregulated after hepatocellular carcinoma induction, and the |
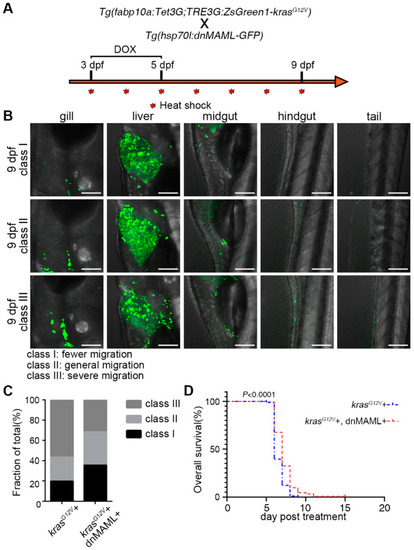
Inhibition of the Notch signaling pathway after liver cancer induction reduced cancer cell migration and improved survival. ( |