IMAGE

Figure 4

ID
ZDB-IMAGE-220518-114
Source
Figures for Sun et al., 2022
Image
Figure Caption

Figure 4

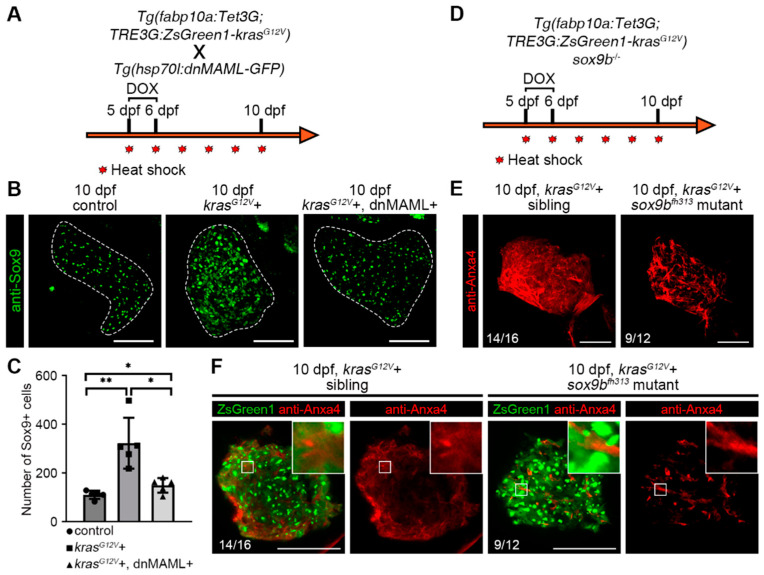
Hepatic Sox9 expression is upregulated after hepatocellular carcinoma induction, and the sox9bfh313 mutant suppressed hepatocyte dedifferentiation. (A) Tg(fabp10a:Tet3G;TRE3G:krasG12V-ZsGreen1) with Tg(Hsp70l:dnMAML-GFP) double transgenic fish line treatment strategy. (B,C) Sox9 antibody staining indicated the number of Sox9+ cells in the liver at 10 dpf in the DOX-induced control (n = 5), krasG12V+ (n = 5) and krasG12V+ and dnMAML+ (n = 5) groups with statistical results. (D) Tg(fabp10a:Tet3G;TRE3G:krasG12V-ZsGreen1) treatment strategy in sox9bfh313 mutant. (E) Three-dimensional images of Anxa4 antibody staining showed biliary duct changes in the DOX-induced krasG12V+ and krasG12V+ sox9bfh313 mutants at 8 dpf and 10 dpf. (F) Monolayer images of Anxa4 antibody staining biliary duct changes in the DOX-induced krasG12V+ and krasG12V+ sox9bfh313 mutant at 8 dpf and 10 dpf. Asterisks show significance: *—p < 0.05; **—p < 0.01. Scale bars—100 μm; error bars—S.D.

Acknowledgments
This image is the copyrighted work of the attributed author or publisher, and ZFIN has permission only to display this image to its users. Additional permissions should be obtained from the applicable author or publisher of the image. Full text @ Int. J. Mol. Sci.