IMAGE

Figure 3

ID
ZDB-IMAGE-220518-113
Source
Figures for Sun et al., 2022
Image
Figure Caption

Figure 3

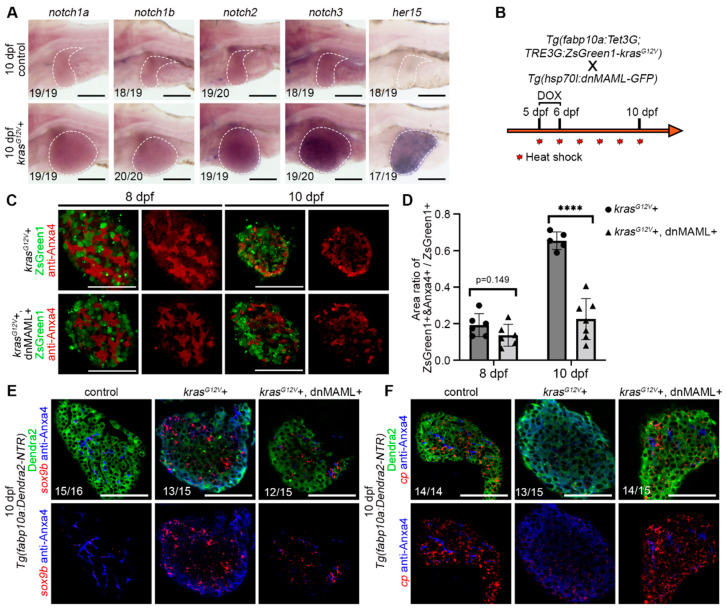
The Notch signaling pathway was upregulated after hepatocellular carcinoma induction, and the inhibition of Notch signaling suppressed hepatocyte dedifferentiation. (A) WISH results showed the expression pattern of notch1a, notch1b, notch2, notch3, and her15 at 10 dpf after DOX activation of krasG12V. (B) Tg(fabp10a:Tet3G;TRE3G:krasG12V-ZsGreen1) with Tg(Hsp70l:dnMAML-GFP) double transgenic fish line treatment strategy. (C) Monolayer images of Anxa4 antibody staining showed expression changes in the DOX-induced krasG12V+ and krasG12V+ and dnMAML+ groups at 8 dpf and 10 dpf. (D) Statistics of Anxa4 + and ZsGreen1 + /ZsGreen1+ ratio in the DOX-induced krasG12V+ (n = 11) and krasG12V+ and dnMAML+ (n = 13) groups at 8 dpf and 10 dpf. (E) The results of fluorescent in situ hybridization (FISH) showed sox9b expression in the DOX-induced control and krasG12V+ and krasG12V+ and dnMAML+ groups at 10 dpf. (F) The results of FISH showed cp expression in the DOX-induced control, krasG12V+ and krasG12V+ and dnMAML+ groups at 10 dpf. Numbers indicate the proportion of larvae exhibiting that expression. Asterisks show significance: ****—p < 0.0001. Scale bars—100 μm; error bars—S.D.

Acknowledgments
This image is the copyrighted work of the attributed author or publisher, and ZFIN has permission only to display this image to its users. Additional permissions should be obtained from the applicable author or publisher of the image. Full text @ Int. J. Mol. Sci.