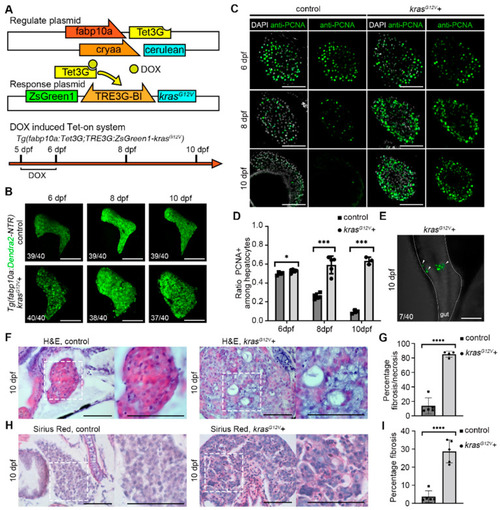
Induction of krasG12V overexpression in zebrafish liver cancer by Tet-On system. (A) Components of the Tet-On system and doxycycline (DOX) treatment strategy for induction of liver cancer. (B) Confocal images showed zebrafish liver after DOX activation of krasG12V from 6 days postfertilization (dpf) to 10 dpf. (C,D) antibody staining results of proliferating cell nuclear antigen (PCNA) in the control group (n = 11) and krasG12V+ group (n = 13). (E) Confocal images showed the presence of a green, fluorescent signal in the intestine outside the liver after DOX activation of krasG12V. (F) H&E staining to confirm the morphology of the liver in the control and krasG12V+ groups. (G) Statistics of the percentage fibrosis/necrosis area in the liver in the control (n = 5) and krasG12V+ (n = 4) groups. (H) Sirius Red staining of the liver in the control and krasG12V+ groups. (I) Statistics of the percentage fibrosis area in the liver in the control (n = 5) and krasG12V+ (n = 5) groups. Numbers indicate the percentage of larvae exhibiting this expression. Asterisks show significance: *—p < 0.05; ***—p < 0.001; ****—p < 0.0001. Scale bars—100 μm; error bars—S.D.
|
