
- Title
-
Ferroptosis and Apoptosis Are Involved in the Formation of L-Selenomethionine-Induced Ocular Defects in Zebrafish Embryos
- Authors
- Gao, M., Hu, J., Zhu, Y., Wang, X., Zeng, S., Hong, Y., Zhao, G.
- Source
- Full text @ Int. J. Mol. Sci.
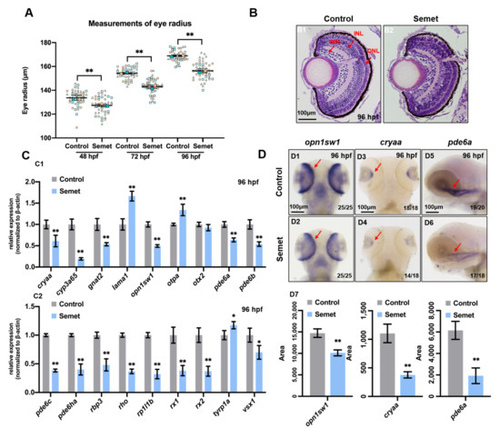
Figure 1. Eye developmental defects in selenium-treated embryos. (A) Measurement of eye radius of embryos from control and selenium-treated groups at 48 hpf, 72 hpf and 96 hpf. (B) H&E staining analysis of embryonic eyes from control and selenium-treated groups at 96 hpf (red arrows indicate GCL, INL and ONL layer of retina). (C) Expressions of eye marker genes in embryos from control and selenium-treated groups at 96 hpf (C1,C2). (D) WISH data of opn1sw1, cryaa and pde6a in embryos from control and selenium-treated groups at 96 hpf (D1–D6). Quantification analysis of the WISH data in different samples (D7). **, P < 0.01; *, P < 0.05. |
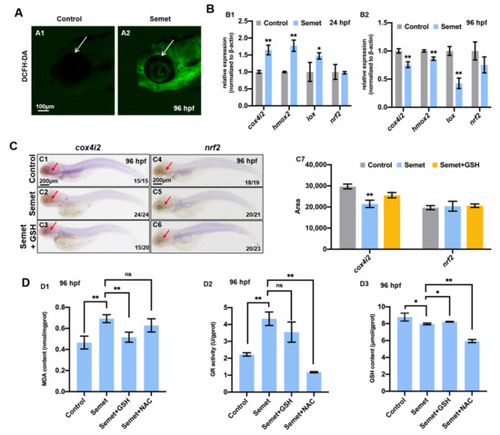
Figure 2. Oxidative stress in selenium-treated embryos. (A) ROS levels in control and selenium-treated embryos at 96 hpf were indicated by DCFH-DA staining. (B) Expression of oxidative stress marker genes in control and selenium-treated embryos at 24 hpf (B1) and 96 hpf (B2). (C) WISH data of cox4i2 and nrf2 in embryos from control, semet and semet plus GSH groups at 96 hpf (C1–C6). Quantification analysis of the WISH data in different samples (C7). (D) MDA content (D1), GR activity (D2) and GSH content (D3) in control, semet, semet plus GSH and semet plus NAC embryos at 96 hpf. **, P < 0.01; *, P < 0.05. |
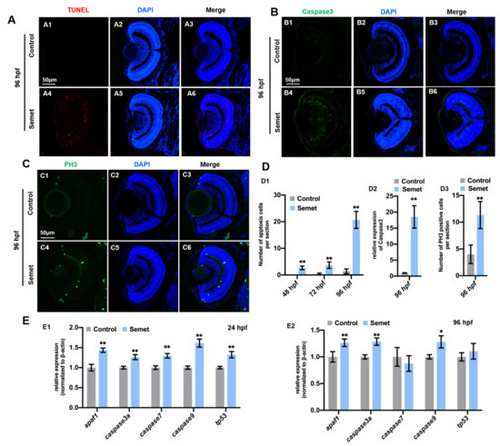
Figure 3. Cell apoptosis and proliferation in selenium-treated embryos. (A) Cell apoptosis assay by TUNEL (red dots) detection in section of control (A1–A3) and selenium-treated (A4–A6) embryos at 96 hpf. (B) Immunostaining of Caspase3 in section of control (B1–B3) and selenium-treated (B4–B6) embryos at 96 hpf. (C) Cell proliferation assay by PH3 staining (green dots) in section of control (C1–C3) and selenium-treated (C4–C6) embryos at 96 hpf. (D) Number of apoptosis cells (D1), relative expression of caspase3 (D2) and number of PH3 positive cells (D3). (E) Expression of apoptosis marker genes in control and selenium-treated embryos at 24 hpf (E1) and 96 hpf (E2). **, P < 0.01; *, P < 0.05. |
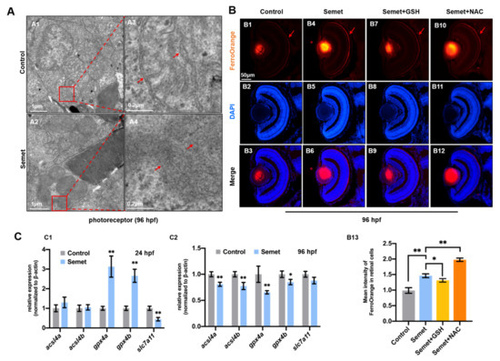
Figure 4. Ferroptosis in selenium-treated embryos. (A) TEM analysis of retinal cells in control and selenium-stressed embryos at 96 hpf (red squares and arrows indicate mitochondria). (A3,A4) are magnified domains of red boxes marked in (A1,A2), respectively. (B) Iron distribution assay by FerroOrange probe in control, semet, semet plus GSH and semet plus NAC groups at 96 hpf (B1–B12). Measurement of FerroOrange staining in retinal cells (B13). (C) Expressions of ferroptosis marker genes in control and selenium-treated embryos at 24 hpf (C1) and 96 hpf (C2). **, P < 0.01; *, P < 0.05. |
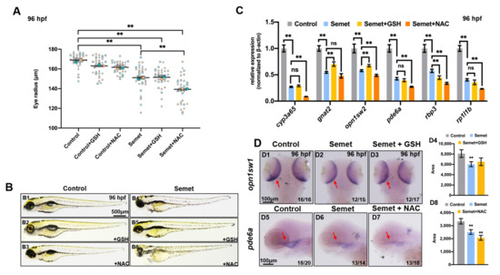
Figure 5 Figure 5. Effect of ocular defects with addition of ROS scavenger GSH and NAC. (A) Measurement of eye radius of embryos from control, semet, semet plus GSH and semet plus NAC groups at 96 hpf. (B) Phenotypes of representative control, semet, semet plus GSH and semet plus NAC groups at 96 hpf. (C) The expression of eye marker genes in control, semet, semet plus GSH and semet plus NAC groups at 96 hpf. (D) WISH data of opn1sw1 (D1–D3) and pde6a (D5–D7) in control, semet, semet plus GSH and semet plus NAC groups at 96 hpf. Quantification analysis of the WISH data of opn1sw1 (D4) and pde6a (D8) in different samples. **, P < 0.01; *, P < 0.05.
|
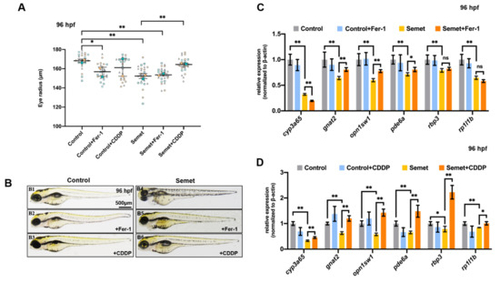
Figure 6. Effect of ocular defects with addition of ferroptosis inhibitor Fer-1 and activator CDDP. (A) Measurement of eye radius of embryos from control, semet, semet plus Fer-1 and semet plus CDDP groups at 96 hpf. (B) Phenotypes of representative control, semet, semet plus Fer-1 and semet plus CDDP groups at 96 hpf. (C) The expression of eye marker genes in control, semet and semet plus Fer-1 groups at 96 hpf. (D) The expression of eye marker genes in control, semet and semet plus CDDP groups at 96 hpf. **, P < 0.01; *, P < 0.05.
|
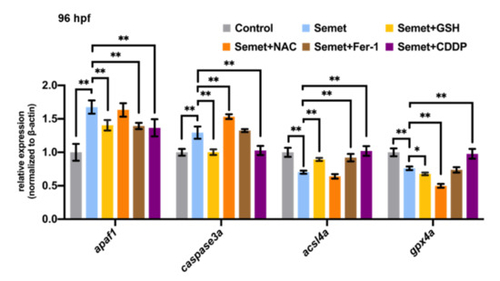
Figure 7. Effects of GSH, Fer-1, NAC and CDDP on ferroptosis and apoptosis in selenium-treated embryos at 96 hpf. **, P < 0.01; *, P < 0.05. |