
|
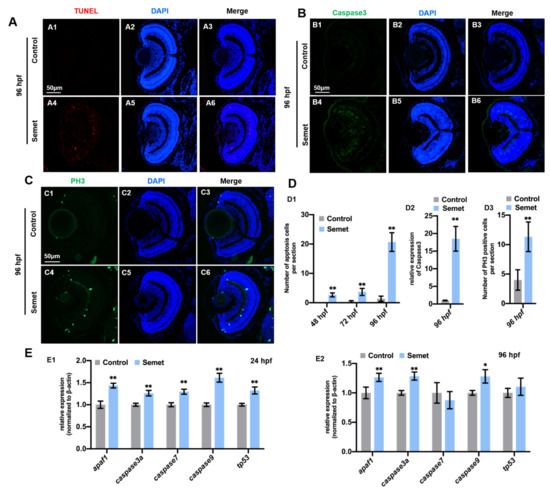
Fig. 3 Figure 3. Cell apoptosis and proliferation in selenium-treated embryos. (A) Cell apoptosis assay by TUNEL (red dots) detection in section of control (A1–A3) and selenium-treated (A4–A6) embryos at 96 hpf. (B) Immunostaining of Caspase3 in section of control (B1–B3) and selenium-treated (B4–B6) embryos at 96 hpf. (C) Cell proliferation assay by PH3 staining (green dots) in section of control (C1–C3) and selenium-treated (C4–C6) embryos at 96 hpf. (D) Number of apoptosis cells (D1), relative expression of caspase3 (D2) and number of PH3 positive cells (D3). (E) Expression of apoptosis marker genes in control and selenium-treated embryos at 24 hpf (E1) and 96 hpf (E2). **, P < 0.01; *, P < 0.05.