
|
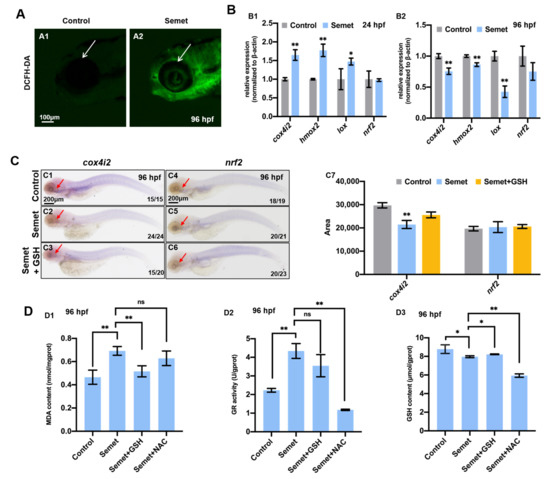
Fig. 2 Figure 2. Oxidative stress in selenium-treated embryos. (A) ROS levels in control and selenium-treated embryos at 96 hpf were indicated by DCFH-DA staining. (B) Expression of oxidative stress marker genes in control and selenium-treated embryos at 24 hpf (B1) and 96 hpf (B2). (C) WISH data of cox4i2 and nrf2 in embryos from control, semet and semet plus GSH groups at 96 hpf (C1–C6). Quantification analysis of the WISH data in different samples (C7). (D) MDA content (D1), GR activity (D2) and GSH content (D3) in control, semet, semet plus GSH and semet plus NAC embryos at 96 hpf. **, P < 0.01; *, P < 0.05.