
Fig. 1
|
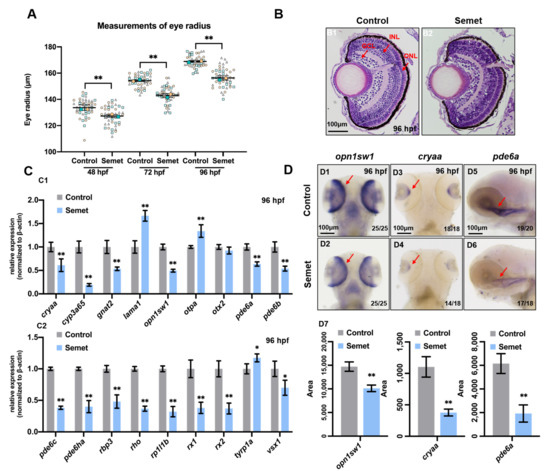
Fig. 1 Figure 1. Eye developmental defects in selenium-treated embryos. (A) Measurement of eye radius of embryos from control and selenium-treated groups at 48 hpf, 72 hpf and 96 hpf. (B) H&E staining analysis of embryonic eyes from control and selenium-treated groups at 96 hpf (red arrows indicate GCL, INL and ONL layer of retina). (C) Expressions of eye marker genes in embryos from control and selenium-treated groups at 96 hpf (C1,C2). (D) WISH data of opn1sw1, cryaa and pde6a in embryos from control and selenium-treated groups at 96 hpf (D1–D6). Quantification analysis of the WISH data in different samples (D7). **, P < 0.01; *, P < 0.05.