
Image
|
Figure Caption
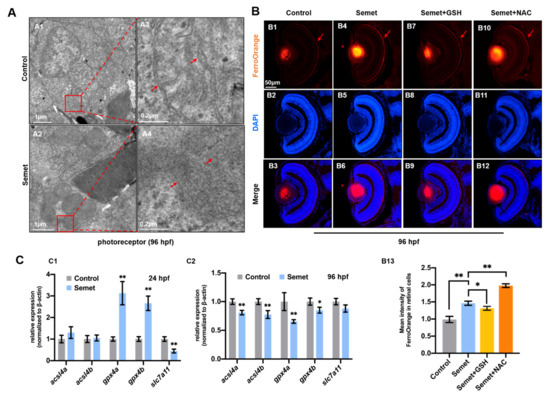
Fig. 4 Figure 4. Ferroptosis in selenium-treated embryos. (A) TEM analysis of retinal cells in control and selenium-stressed embryos at 96 hpf (red squares and arrows indicate mitochondria). (A3,A4) are magnified domains of red boxes marked in (A1,A2), respectively. (B) Iron distribution assay by FerroOrange probe in control, semet, semet plus GSH and semet plus NAC groups at 96 hpf (B1–B12). Measurement of FerroOrange staining in retinal cells (B13). (C) Expressions of ferroptosis marker genes in control and selenium-treated embryos at 24 hpf (C1) and 96 hpf (C2). **, P < 0.01; *, P < 0.05.
Acknowledgments
This image is the copyrighted work of the attributed author or publisher, and
ZFIN has permission only to display this image to its users.
Additional permissions should be obtained from the applicable author or publisher of the image.
Full text @ Int. J. Mol. Sci.