FIGURE SUMMARY
Title

Exploring Macrophage-Dependent Wound Regeneration During Mycobacterial Infection in Zebrafish

Authors
Bohaud, C., Johansen, M.D., Varga, B., Contreras-Lopez, R., Barthelaix, A., Hamela, C., Sapède, D., Cloitre, T., Gergely, C., Jorgensen, C., Kremer, L., Djouad, F.
Source
Full text @ Front Immunol

M. marinum infection impacts on the regrowth of the caudal fin after amputation. (A) Infection and amputation experiment design. (B) Whole larvae infected with low (LD), moderate (MD) and high (HD) doses with the Wasabi-expressing M. marinum M strain, imaged at 48 hpA (Scale bar = 500 µm). (C) Fluorescent pixel counts (FPC) following infection with LD, MD or HD of M. marinum at 96 hpi, corresponding to 48 hpA (mean ± SEM, n> 30, ordinary one-way ANOVA, Tukey’s multiple comparisons test, ****p ≤ 0.0001, *p≤ 0.05). (D) FPC following infection with LD, MD or HD of M. marinum at 120 hpi, corresponding to 72 hpA (mean ± SEM, n> 30, ordinary one-y ANOVA, Tukey’s multiple comparisons test, ****p≤ 0.0001). (E) FPC following infection with LD, MD or HD of M. marinum at 144 hpi, corresponding to 96 hpA (mean ± SEM, n< 30, Mann Whitney test, two-tailed, ****p≤ 0.0001). All larvae died with a HD infection at this timepoint. (F) Representative images of caudal fin regeneration at 48 hpA (Scale bar = 200 µm) with the corresponding graphs showing the fin length after injection of PBS (CT) or infection with LD, MD or HD of M. marinum (mean ± SEM, n> 30, ordinary one-way ANOVA, Dunnett’s multiple comparisons test, compared to control except when indicated, **p ≤ 0.01, ****p ≤ 0.0001). (G) Representative images of caudal fin regeneration at 72 hpA (Scale bar = 200 µm) with the corresponding graphs showing the fin length after injection of PBS (CT) or infection with infection with LD, MD or HD of M. marinum (mean ± SEM, n> 30, ordinary one-way ANOVA, Dunnett’s multiple comparisons test, compared to control except when indicated, *p≤ 0.05, ***p ≤ 0.001, ****p ≤ 0.0001). (H) Representative images of caudal fin regeneration at 96 hpA (Scale bar = 200 µm) with the corresponding graphs showing the fin length after injection of PBS (CT) or infection with LD, MD or HD of M. marinum (mean ± SEM, n<30, Kruskal-Wallis, Dunn’s multiple comparisons test, compared to control except when indicated, *p≤ 0.05, **p≤ 0.01). All larvae died with the HD infection at this timepoint. ND, not determined.

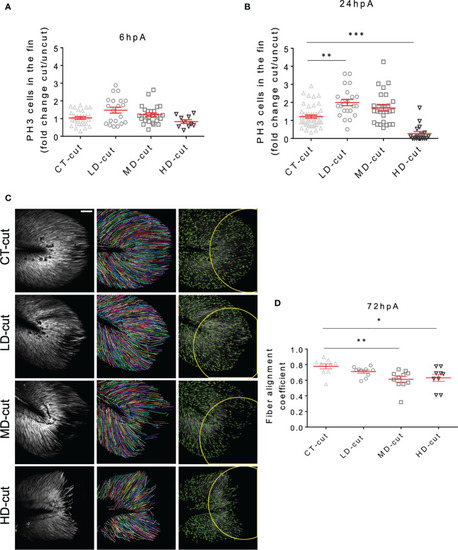
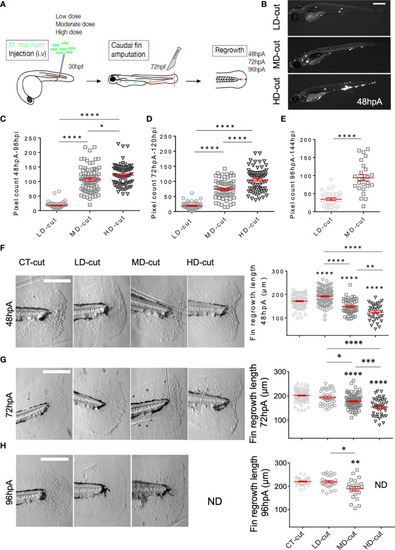
Infection influences cell proliferation, and structure of collagen fibers in the regenerated caudal fin. (A) Blastema cellular proliferation after injection of PBS (CT) or LD, MD and HD infection with M. marinum prior to caudal fin amputation Anti-PH3 antibody staining of the cells in the fin at 6 hpA, expressed as fold change cut/uncut (mean ± SEM, n< 30, Kruskal-Wallis, Dunn’s multiple comparisons test, non-significant). (B) Blastema cell proliferation after injection of PBS (CT) or LD, MD and HD infection with M. marinum prior to caudal fin amputation. Anti-PH3 antibody staining of the cells in the fin at 24 hpA, expressed as fold change cut/uncut (mean ± SEM, n< 30, Kruskal-Wallis, Dunn’s multiple comparisons test, **p≤ 0.01, ***p≤ 0.001). (C) Second harmonic imaging Z projections were done after injection of PBS (CT) or LD, MD and HD of M. marinum at 72 hpA (Scale bar = 60 µm). The procedure of fiber alignment analysis is presented by representative images of the different conditions. The recorded second harmonic images (left) have been subjected to a fiber extraction algorithm (middle) and then the alignment of fiber endpoints (orientation of endpoints are marked with green lines) that were fit inside the fin-width-wide circular region of interests (ROI) (right) were analyzed. (D) Fiber alignment in the circular ROI after injection of PBS (CT) or infection with LD, MD or HD of M. marinum at 72 hpA (mean ± SEM, n<30, Kruskal-Wallis, Dunn’s multiple comparisons test, *p ≤ 0.05, **p ≤ 0.01).

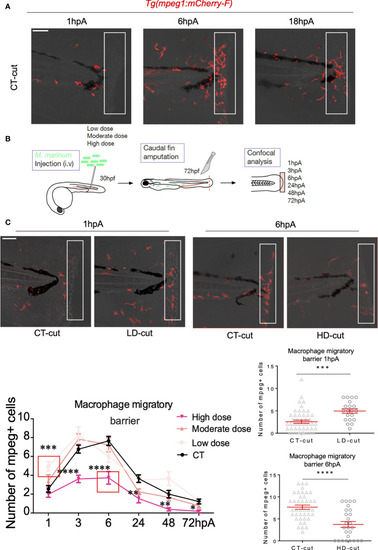
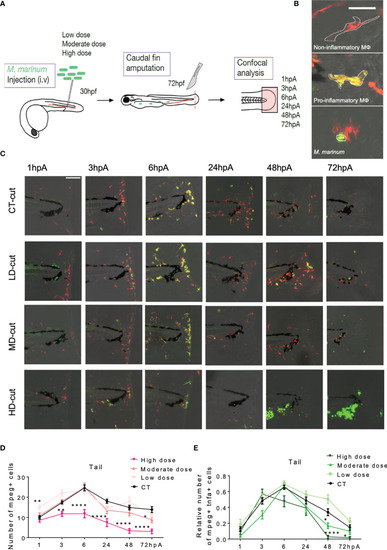
Establishment of the macrophage barrier in the regenerated caudal fin is influenced by the infection. (A) Macrophage barrier under non-infected conditions. Confocal images taken at different timepoints after amputation in non-infected Tg(mpeg1:mCherry-F) larvae, illustrating arrival of macrophages (1 hpA), positioning of macrophages (6 hpA) and departure of macrophages (18 hpA). (B) Experiment design performed in the Tg(mpeg1:mCherry-F) line to study the macrophage barrier under infected conditions. (C) Kinetic of arrival and departure of mpeg+-positive cells, at the caudal fin tip after injection of PBS (CT) or infection with LD, MD or HD of M. marinum at 1, 3, 6, 24, 48 and 72 hpA (mean ± SEM, n< 30, Kruskal-Wallis, Dunn’s multiple comparisons test, *p≤ 0.05, **p≤ 0.01, ***p≤ 0.001, ****p≤ 0.0001). Zoom at 1 hpA with Z projections of confocal images illustrating macrophage mobilization in non-infected (CT-cut) larvae or following LD infection at 1 hpA (Scale bar = 60 µm). Quantification of the number of mpeg+ cells in the fin tip at 1 hpA after injection of PBS (CT) or infection with LD of M. marinum (mean ± SEM, n<30, Kruskal-Wallis, Dunn’s multiple comparisons test, ***p≤ 0.001). Zoom at 6 hpA with Z projections of confocal images illustrating macrophage mobilization in non-infected (CT-cut) larvae or following HD infection at 6 hpA (Scale bar = 60 µm). Quantification of the number of mpeg+ cells in the fin tip at 6 hpA after injection of PBS (CT) or infection with HD of M. marinum (mean ± SEM, n< 30, Kruskal-Wallis, Dunn’s multiple comparisons test, ****p≤ 0.0001).

(A) Experimental design of macrophage recruitment, and activation following infection and amputation. (B) Legends (Z projections of confocal images) to distinguish non-inflammatory macrophages (red) in Tg(mpeg1:mCherry-F) larvae from pro-inflammatory (orange) macrophages in (Tg(mpeg1:mCherry-F;tnfa:eGFP-F) larvae (Scale bar = 30 µm). Wasabi-expressing M. marinum are in green. (C) Z projections of confocal images allowed to establish the kinetic of recruitment and activation of macrophages after injection of PBS (CT) or infection with LD, MD or HD of M. marinum at 1, 3, 6, 24, 48, 72 hpA (Scale bar = 100 µm). (D) Kinetic of total macrophages recruited after fin amputation following injection of PBS (CT) or infection with LD, MD or HD of M. marinum (mean ± SEM, n< 30, Kruskal-Wallis, Dunn’s multiple comparisons test, *p ≤ 0.05, **p ≤ 0.01, ****p ≤ 0.0001). (E) Kinetic of pro-inflammatory macrophages recruitment (expressed as the fold change of mpeg+ and tnfa+ macrophages over the total number of mpeg+ macrophages) after fin amputation following injection of PBS (CT) or infection with LD, MD or HD of M. marinum (mean ± SEM, n<30, Kruskal-Wallis, Dunn’s multiple comparisons test, *p ≤ 0.05, ****p ≤ 0.0001).

M. marinum infection impacts on macrophages viability in the regenerated caudal fin. (A) Expression of tnfa transcripts in uncut and cut caudal fins after injection of PBS (CT) or infection with LD, MD or HD of M. marinum at 3 hpA. Analysis was performed by RT-qPCR and results are expressed as the tnfa/ef1a ratio (mean ± SEM, n=5-6, Kruskal-Wallis, Dunn’s multiple comparisons test, *p ≤ 0.05, **p ≤ 0.01). (B) Expression of il1b transcripts in uncut and cut caudal fins after injection of PBS (CT) or infection with LD, MD or HD of M. marinum at 3 hpA. Analysis was performed by RT-qPCR and results are expressed as the il1b/ef1a ratio (mean ± SEM, n = 5-6, Kruskal-Wallis, Dunn’s multiple comparisons test, *p≤ 0.05). (C) Experimental design to study macrophage viability using flow cytometry. (D) Percentage of total apoptotic and necrotic macrophages (mpeg+ cells) in the whole larva after injection of PBS (CT) or infection with LD, MD or HD of M. marinum at 48 hpA was obtained by flow cytometry (mean ± SEM, n = 4-5, Mann Whitney test, one tailed, *p ≤ 0.05).

A model describing the macrophage response during the caudal fin regeneration of zebrafish larvae infected with M. marinum. (A) Infection and amputation experiment design. Injection of low, moderate and high doses of M. marinum in the caudal vein at 30 hpf then amputation of the caudal fin at 72 hpf. (B) Schematic representation of the mycobacteria dose effect on the macrophage response. The low dose accelerated the macrophage response from 1 hpA as revealed by the more rapid macrophage recruitment and alignment at the fin tip. The moderate dose triggered more granuloma formation and necrosis of macrophages leading to a decreased inflammatory response at 72 hpA. The high dose also caused more granuloma formation, necrosis of macrophages resulting in the absence of macrophage response at 72 hpA. (C) Schematic representation of the mycobacteria dose effects on the caudal fin regrowth. The regeneration process was accelerated with the low dose, decreased with the moderate dose and completely lost with the high dose.

Acknowledgments
This image is the copyrighted work of the attributed author or publisher, and ZFIN has permission only to display this image to its users. Additional permissions should be obtained from the applicable author or publisher of the image. Full text @ Front Immunol