IMAGE

Figure 3

ID
ZDB-IMAGE-220413-4
Source
Figures for Bohaud et al., 2022
Image
Figure Caption

Figure 3

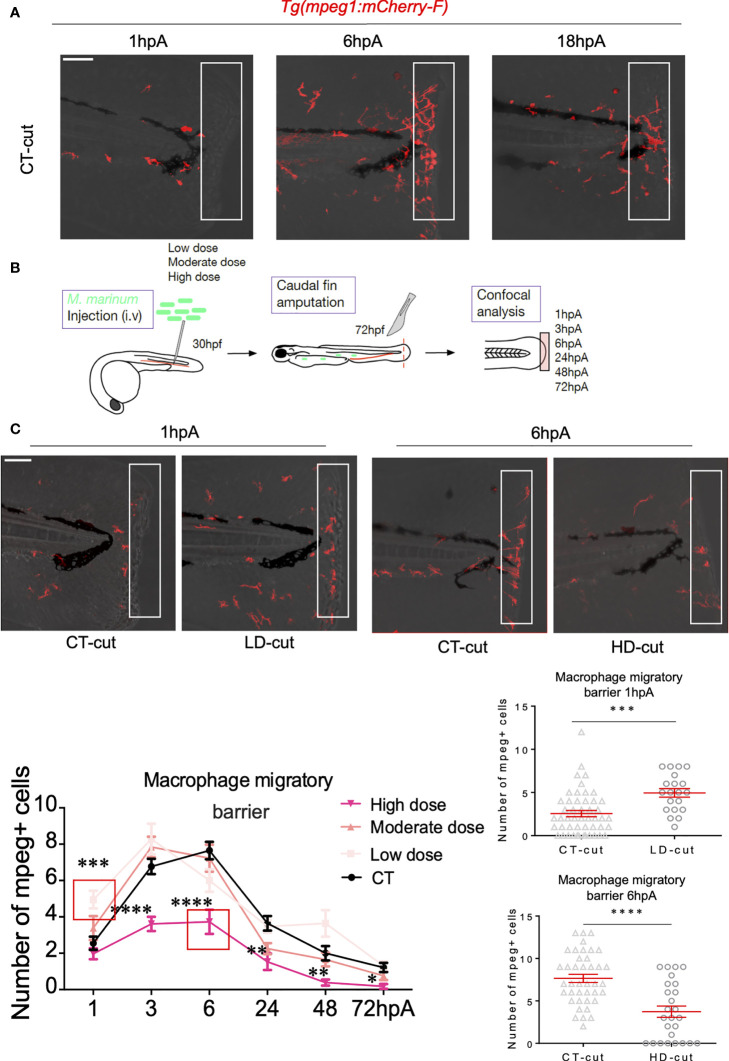
Establishment of the macrophage barrier in the regenerated caudal fin is influenced by the infection. (A) Macrophage barrier under non-infected conditions. Confocal images taken at different timepoints after amputation in non-infected Tg(mpeg1:mCherry-F) larvae, illustrating arrival of macrophages (1 hpA), positioning of macrophages (6 hpA) and departure of macrophages (18 hpA). (B) Experiment design performed in the Tg(mpeg1:mCherry-F) line to study the macrophage barrier under infected conditions. (C) Kinetic of arrival and departure of mpeg+-positive cells, at the caudal fin tip after injection of PBS (CT) or infection with LD, MD or HD of M. marinum at 1, 3, 6, 24, 48 and 72 hpA (mean ± SEM, n< 30, Kruskal-Wallis, Dunn’s multiple comparisons test, *p≤ 0.05, **p≤ 0.01, ***p≤ 0.001, ****p≤ 0.0001). Zoom at 1 hpA with Z projections of confocal images illustrating macrophage mobilization in non-infected (CT-cut) larvae or following LD infection at 1 hpA (Scale bar = 60 µm). Quantification of the number of mpeg+ cells in the fin tip at 1 hpA after injection of PBS (CT) or infection with LD of M. marinum (mean ± SEM, n<30, Kruskal-Wallis, Dunn’s multiple comparisons test, ***p≤ 0.001). Zoom at 6 hpA with Z projections of confocal images illustrating macrophage mobilization in non-infected (CT-cut) larvae or following HD infection at 6 hpA (Scale bar = 60 µm). Quantification of the number of mpeg+ cells in the fin tip at 6 hpA after injection of PBS (CT) or infection with HD of M. marinum (mean ± SEM, n< 30, Kruskal-Wallis, Dunn’s multiple comparisons test, ****p≤ 0.0001).

Acknowledgments
This image is the copyrighted work of the attributed author or publisher, and ZFIN has permission only to display this image to its users. Additional permissions should be obtained from the applicable author or publisher of the image. Full text @ Front Immunol