IMAGE

Figure 1

ID
ZDB-IMAGE-220413-2
Source
Figures for Bohaud et al., 2022
Image
Figure Caption

Figure 1

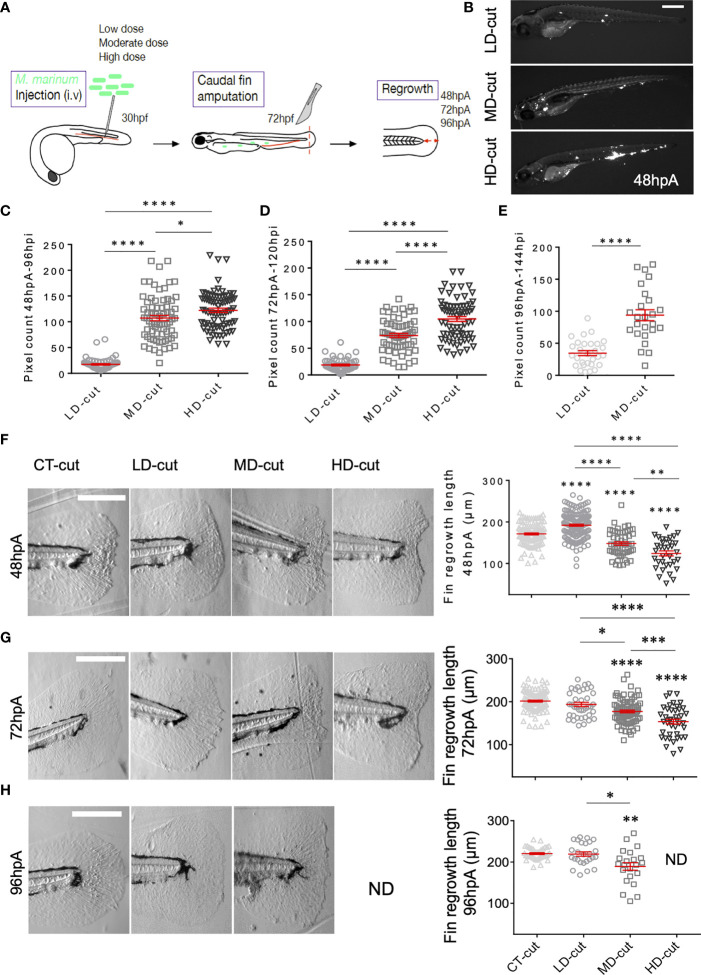
M. marinum infection impacts on the regrowth of the caudal fin after amputation. (A) Infection and amputation experiment design. (B) Whole larvae infected with low (LD), moderate (MD) and high (HD) doses with the Wasabi-expressing M. marinum M strain, imaged at 48 hpA (Scale bar = 500 µm). (C) Fluorescent pixel counts (FPC) following infection with LD, MD or HD of M. marinum at 96 hpi, corresponding to 48 hpA (mean ± SEM, n> 30, ordinary one-way ANOVA, Tukey’s multiple comparisons test, ****p ≤ 0.0001, *p≤ 0.05). (D) FPC following infection with LD, MD or HD of M. marinum at 120 hpi, corresponding to 72 hpA (mean ± SEM, n> 30, ordinary one-y ANOVA, Tukey’s multiple comparisons test, ****p≤ 0.0001). (E) FPC following infection with LD, MD or HD of M. marinum at 144 hpi, corresponding to 96 hpA (mean ± SEM, n< 30, Mann Whitney test, two-tailed, ****p≤ 0.0001). All larvae died with a HD infection at this timepoint. (F) Representative images of caudal fin regeneration at 48 hpA (Scale bar = 200 µm) with the corresponding graphs showing the fin length after injection of PBS (CT) or infection with LD, MD or HD of M. marinum (mean ± SEM, n> 30, ordinary one-way ANOVA, Dunnett’s multiple comparisons test, compared to control except when indicated, **p ≤ 0.01, ****p ≤ 0.0001). (G) Representative images of caudal fin regeneration at 72 hpA (Scale bar = 200 µm) with the corresponding graphs showing the fin length after injection of PBS (CT) or infection with infection with LD, MD or HD of M. marinum (mean ± SEM, n> 30, ordinary one-way ANOVA, Dunnett’s multiple comparisons test, compared to control except when indicated, *p≤ 0.05, ***p ≤ 0.001, ****p ≤ 0.0001). (H) Representative images of caudal fin regeneration at 96 hpA (Scale bar = 200 µm) with the corresponding graphs showing the fin length after injection of PBS (CT) or infection with LD, MD or HD of M. marinum (mean ± SEM, n<30, Kruskal-Wallis, Dunn’s multiple comparisons test, compared to control except when indicated, *p≤ 0.05, **p≤ 0.01). All larvae died with the HD infection at this timepoint. ND, not determined.

Acknowledgments
This image is the copyrighted work of the attributed author or publisher, and ZFIN has permission only to display this image to its users. Additional permissions should be obtained from the applicable author or publisher of the image. Full text @ Front Immunol