|
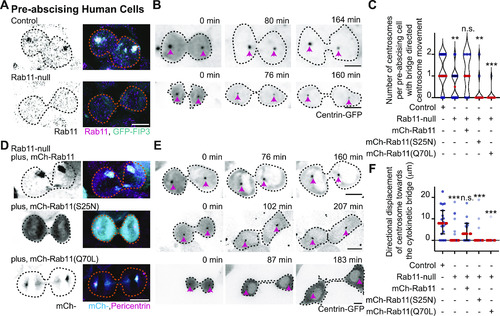
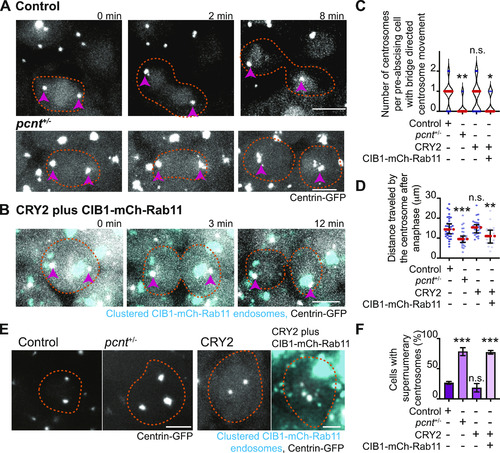
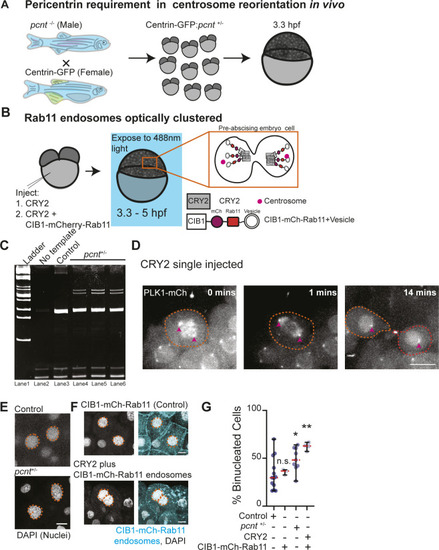
Pericentrin and Rab11 endosomes coordinate centrosome movement and number during mitotic exit.(A, B) Time-lapse imaging of control cells (A), pcnt+/− cells (A), and cells with clustered Rab11 endosomes (B, cyan) from a -5actb2:cent4-GFP(centrin-GFP, gray) embryo. Pink arrows, centrosome. Dashed orange line, cell boundaries. Scale bar, 10 μm. (C, D) Number of centrosomes per pre-abscising cell with bridge directed centrosome movement calculated as both centrosomes (2 centrosomes), only one centrosome (1 centrosome) and neither centrosome (0 centrosomes) moved depicted as a violin plot with median (orange dashed line) and quartiles (dark dotted lines, C), and distance traveled by the centrosome after anaphase (scatter plot with median, orange dashed line, and quartiles, dark lines, D) in control, pcnt+/−, CRY2 injected, or CRY2 plus CIB1-mCh-Rab11 injected embryos is shown. n > 16 cells across n > 3 embryos. One-way ANOVA with Dunnett’s multiple comparison to control, n.s. not significant, *P < 0.05, **P < 0.01 and ***P < 0.001. (E, F) Interphase centrin-GFP (gray) zebrafish embryos with n = 2 centrosomes or supernumerary (n > 2 centrosomes) in control, pcnt+/−, CRY2 injected, CRY2 plus CIB1-Rab11 injected embryos (cyan, CIB1-mCh-Rab11 plus CRY2). (E) Orange dashed lines, cell boundaries. Scale bar, 5 μm. (F) Percentage of cells with supernumerary centrosomes (n > 2 centrosomes). n > 30 cells per embryo across n > 3 embryos. One-way ANOVA with Dunnett’s multiple comparison to control, n.s. not significant and ***P < 0.001. (C, D, F) n values and statistical results detailed in Table S1.
|