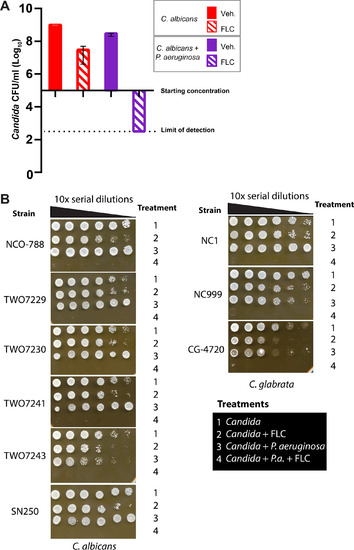
FIG 1 Fluconazole is synergistic with P. aeruginosa against C. albicans and C. glabratain vitro. (A) C. albicans+P. aeruginosa + FLC shows a fungicidal effect after coculture. P. aeruginosa and C. albicans were inoculated at 2 × 10⁵/mL and FLC was added at 12.5 μg/mL. Drops (3 μL) of serial 10x dilutions of cocultures were plated on YPD containing antibiotics. Representative of >20 independent experiments. (B) Fungicidal effect of P. aeruginosa with FLC for multiple FLC-resistant and -sensitive clinical isolates of C. albicans and C. glabrata when tested at >2x MIC50. MIC50 was tested separately and supra-MICs of FLC were used (per measurements relevant for our assays; Table S1). Representative results of at least three independent experiments are shown.
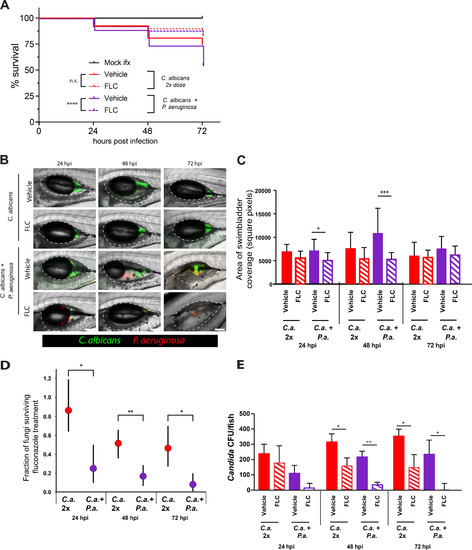
FIG 2 Fluconazole is synergistic with P. aeruginosa against C. albicans during mucosal infection. (A–E) Fish were infected in the swimbladder with either 50–100 C. albicans (mono-infection) or with 25–50 C. albicans and 25–50 P. aeruginosa, screened for fungal inoculum, then reared in water with or without 100 μg/mL FLC. (A) FLC-treatment increases survival during co-infection. Data pooled from 13 independent experiments. (B) Representative images of swimbladder infected with C. albicans or C. albicans + P. aeruginosa with or without FLC (100 μg/mL). Scale bars = 100 μm. Dotted white lines mark the boundary of the swimbladder. (C) C. albicans burden was measured by analysis of confocal z-stacks and calculation of square pixel coverage area. Graphs show medians and 95% confidence intervals. Data from 13 independent experiments. (D) Fraction of fungi surviving FLC treatment. Results are from 5 independent experiments. Monte-Carlo analysis was used to compare groups. (E) C. albicans burden calculated by CFU. Data from 5 independent experiments. (p > 0.05 NS; < 0.05 *; <0.01 **; <0.001 ***; <0.0001 ****).
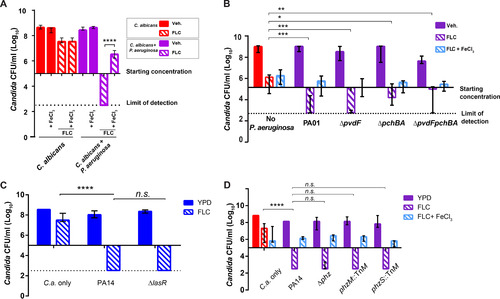
FIG 3 Iron supplementation partially reverses fungicidal effect in vitro, but phenazines and quorum sensing do not contribute to the effect. (A) FeCl3 supplementation reverses P. aeruginosa-FLC synergy in vitro. Cocultures were performed with or without FLC treatment (12.5 μg/mL) and/or FeCl3 (1 mM). Data from 3 independent experiments. (B) C. albicans growth after 48 h cocultures with P. aeruginosa WT or siderophore mutants: ΔpvdF, ΔpchB, ΔpvdFpchBA. Bar graph represents C. albicans growth in log10 CFU/mL. Data is representative of 4 independent experiments and medians with interquartile ranges from three independent experiments are shown. (C) Cocultures of C. albicans with P. aeruginosa WT or ΔlasR mutant PA14 ΔlasR mutant is synergistic with FLC. Bar graph represents C. albicans growth in log10 CFU/mL. Data is representative of 3 independent experiments. (D) Coculture of C. albicans with P. aeruginosa WT or phenazine deficient strains: PA14 Δphz, PA14 phzM::TnM, PA14 phzS::TnM in the presence or absence of FLC (12.5 μg/mL). Bar graph represents C. albicans growth in log10 CFU/mL. Data is representative of 3 independent experiments. Data shown are the median with ranges. (p > 0.05 NS; < 0.05 *; <0.01 **; <0.001 ***; <0.0001 ****).
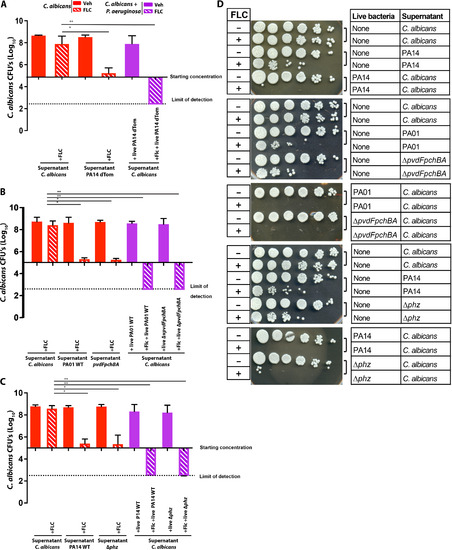
FIG 4P. aeruginosa supernatants exhibit mild synergy with FLC compared to live Pseudomonas. P. aeruginosa and C. albicans were grown overnight in YPD media at 30°C. Overnight cultures supernatants were sterile filtered and added to 4 × 10⁵C. albicans in YPD liquid media along with 12.5 μg/mL of FLC. After 48 h of incubation at 30°C, cultures were 10-fold diluted and spotted onto YPD plates with antibiotics to count CFU. (A) Supernatant from PA14-dTom strain, (B) Supernatant from PA01 WT and ΔpvdFpchBA, (C) Supernatant from PA14 WT and Δphz, (D) Representative images of YPD plates showing the growth of C. albicans after 24 h of incubation. Data from 3 independent experiments. (p > 0.05 NS; < 0.05 *; <0.01 **; <0.001 ***; <0.0001 ****).
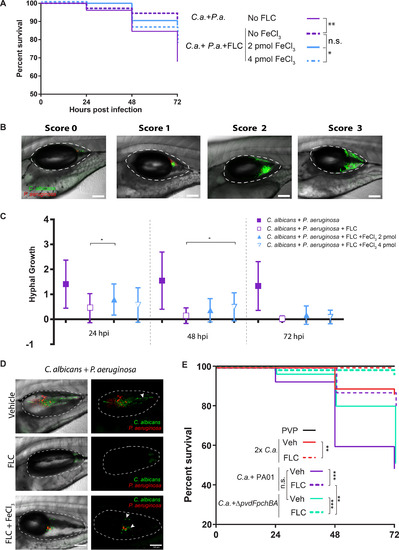
FIG 5 Iron homeostasis contributes to P. aeruginosa-mediated synergy with FLC during infection. (A) FeCl3 supplementation partially reverses P. aeruginosa-FLC synergy in vivo. Zebrafish injected with indicated microbes in the swimbladder with or without the indicated amounts of FeCl3.(2 or 4 pmol). Data pooled from 4 independent experiments. (B) Hyphal growth during infection was scored using double-blind methodology. Representative images of each score: 0-no hyphal growth; 1- < 10% coverage of swimbladder; 2- 10-50% coverage of swimbladder; 3- > 50% coverage of swimbladder. (C) FeCl3 supplementation is associated with stronger hyphal growth in vivo. Data shown are the medians with interquartile ranges from three experiments. (D) Representative images of scored hyphal growth in the swimbladder at 24 hpi. Shown are median fish from each cohort. (E) FLC treatment has no loss of effectiveness in co-infections with P. aeruginosa siderophore mutant. Scale bars = 100 μm. (p > 0.05 NS; < 0.05 *; <0.01 **; <0.001 ***; <0.0001 ****).
Acknowledgments
This image is the copyrighted work of the attributed author or publisher, and
ZFIN has permission only to display this image to its users.
Additional permissions should be obtained from the applicable author or publisher of the image.
Full text @ Infect. Immun.
Your Input Welcome
Thank you for submitting comments. Your input has been emailed to ZFIN curators who may contact you if
additional information is required.
Oops. Something went wrong. Please try again later.