FIGURE SUMMARY
Title

Zebrafish Vascular Quantification (ZVQ): a tool for quantification of three-dimensional zebrafish cerebrovascular architecture by automated image analysis

Authors
Kugler, E.C., Frost, J., Silva, V., Plant, K., Chhabria, K., Chico, T.J.A., Armitage, P.A.
Source
Full text @ Development

ZVQ workflow overview. (A) Workflow of ZVQ. First, the original images (On) are motion corrected, enhanced (En) and segmented (Sen). Registration to template embryo brings all embryos into one spatial coordinate system (Ren), allowing quantification of similarity (Sn), and is followed by the generation of a population average map (PAM). For examination of specific regions of vascular development, a region of interest (ROI) can be specified. Following ROI extraction, volume (Vn), surface voxel (An) and vascular density (ρn) are quantified. Euclidean distance maps (EDMn) are combined with vascular skeletons (Skn) to quantify radius in skeletonised distance maps (SDMn and Rn), which are also used to quantify network length (Ln), branching points (BPn) and complexity (Cn) via Sholl analysis. (B) Schematic of the vascular parameters extracted by ZVQ.

Application of ZVQ to embryos from 2 to 5 dpf to analyse vascular growth. (A) Depth-coded MIP showing regions of overlap (purple, ventral; white, dorsal) of six fish before registration from 2 to 5 dpf. (B) Depth-coded MIP showing regions of overlap (purple, ventral; white, dorsal) of six fish after manual registration from 2 to 5 dpf. (C) Depth-coded MIP showing regions of overlap (purple, ventral; white, dorsal) of six fish after automatic registration from 2 to 5 dpf. (D) Dice coefficient between template and moving image was increased after application of rigid registration using both anatomical landmark-based and automatic rigid registration from 2 to 5 dpf [2 dpf, n=7; 3 dpf, n=10; 4 dpf, n=10; 5 dpf, n=10; two experimental repeats; Kruskal–Wallis test; ns (P>0.5), **P=0.01-0.001, ****P<0.0001; data are mean±s.d.]. (E) Vascular volume was statistically significantly increased from 2 to 5 dpf (P=0.0008; 2 dpf, n=10; 3 dpf, n=12; 4 dpf, n=13; 5 dpf, n=15; one-way ANOVA; data are mean±s.d.). (F) Vascular surface was not statistically significantly increased from 2 to 5 dpf (P=0.4885; 2 dpf, n=10; 3 dpf, n=11; 4 dpf, n=13; 5 dpf, n=14; two experimental repeats; Kruskal–Wallis test; data are mean±s.d.). (G) Vascular density was not statistically significantly increased from 2 to 5 dpf (P=0.2041; 2 dpf, n=10; 3 dpf, n=11; 4 dpf, n=13; 5 dpf, n=14; two experimental repeats; Kruskal–Wallis test; data are mean±s.d.). (H) Network length was statistically significantly increased from 2 to 5 dpf (P=0.0001; 2 dpf, n=10; 3 dpf, n=12; 4 dpf, n=13; 5 dpf, n=15; Kruskal–Wallis test; mean±s.d.). (I) Branching points were statistically significantly increased from 2 to 5 dpf (P=0.0082; Kruskal–Wallis test; data are mean±s.d.). (J) Average vessel radius was not statistically significantly changed from 2 to 5 dpf (*P>0.9999; Kruskal–Wallis test; data are mean±s.d.). (K) Sholl analysis was conducted to assess vascular complexity, showing no significant increase from 2 to 5 dpf (2-3 dpf, *P=0.0340; 3-4 dpf, P=0.6825; 4-5 dpf P=0.2000; 2-5 dpf, n=5; Kruskal–Wallis test; data are mean±s.d.).

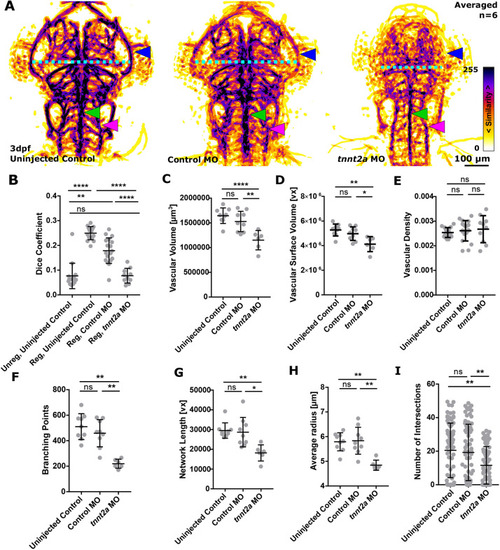
Absent blood flow reduces the cerebral vasculature. (A) MIPs of averaged data of six uninjected controls, control MO and tnnt2a MO following segmentation and registration, showing high inter-embryo similarity in midbrain vessel patterning [PMBC pattern (blue arrowhead), head size (PMBC′ to PMBC″ distance; cyan dotted line), BA (green arrowhead) and PHBC (magenta arrowhead)]. (B) A statistically significant decrease in the Dice coefficient was found when comparing registered control MO to tnnt2a MO (****P<0.0001; uninjected control=15, control MO=18, tnnt2a MO=10; Kruskal–Wallis test; data are mean±s.d.). (C) Vascular volume was statistically significantly decreased in tnnt2a MO (uninjected control, ****P<0.0001; control MO, ****P<0.0001; uninjected control=9, control MO=9, tnnt2a MO=6; one-way ANOVA; data are mean±s.d.). (D) Vascular surface was statistically significantly decreased in tnnt2a MO (uninjected control, P<0.0001; control MO, P=0.0007; Kruskal–Wallis test; data are mean±s.d.). (E) Vascular density was not statistically significantly changed in tnnt2a MO (uninjected control, P=0.6514; control MO, P=0.9082; one-way ANOVA; data are mean±s.d.). (F) Branching points were statistically significantly decreased in tnnt2a MO (uninjected control, P=0.0019; control MO, P=0.0092; Kruskal–Wallis test; data are mean±s.d.). (G) Vascular network length was statistically significantly decreased in tnnt2a MO (uninjected control, P=0.0033; control MO, P=0.0209; Kruskal–Wallis test; data are mean±s.d.). (H) Average vessel radius was statistically significantly decreased in tnnt2a MO (uninjected control, P=0.0050; control MO, P=0.0067; Kruskal–Wallis test; data are mean±s.d.). (I) Vascular complexity was statistically significantly decreased in tnnt2a MO (uninjected control, P=0.0050; control MO, P=0.0067; Kruskal–Wallis test; data are mean±s.d.).

Short-term inhibition of VEGF reduces vascular topology parameters. (A) MIPs of averaged data of control and AV951-treated samples following segmentation and registration showed no visual phenotype [PMBC pattern (blue arrowhead), head size (PMBC′ to PMBC″ distance; cyan dotted line), BA (green arrowhead), CtAs (yellow arrowhead) and PHBC (magenta arrowhead)]. (B) No statistically significant difference was found when comparing registered controls with VEGF inhibitor-treated samples (P>0.9999; control=18, AV951=23; Kruskal–Wallis test; data are mean±s.d.). (C) Vascular volume was statistically significantly decreased in AV951-treated samples (P=0.0014; control=22, AV951=23; two-tailed Mann–Whitney U-test; data are mean±s.d.). (D) Vascular surface was statistically significantly decreased in AV951-treated samples (P=0.0010; two-tailed Mann–Whitney U-test; data are mean±s.d.). (E) Vascular density was not statistically significantly changed in AV951-treated samples (P=0.1048; unpaired two-tailed Student's t-test; data are mean±s.d.). (F) Branching points were statistically significantly decreased in AV951-treated samples (P=0.0016; two-tailed Mann–Whitney U-test; data are mean±s.d.). (G) Vascular network length was statistically significantly changed in AV951-treated samples (P=0.0004; two-tailed Mann–Whitney U-test; data are mean±s.d.). (H) Average vessel radius was statistically significantly reduced in AV951-treated samples (P=0.0371; unpaired two-tailed Student's t-test; data are mean±s.d.). (I) Vascular complexity was not statistically significantly changed in AV951-treated samples (P=0.4949; two-tailed Mann–Whitney U-test; data are mean±s.d.).

Quantification of vascular parameters and cluster analysis. (A) Percentage differences in mean values were quantified for the measured parameters (control MO to MO, and untreated to treated). (B) Cluster analysis identified four main clusters, including (1) inhibitors of anti-angiogenic factors (notch1b MO and Notch inhibition), (2) factors inducing cellular changes (osmotic pressure and membrane rigidity changes), (3) factors with severe angiogenic defects (dll4 MO, actin polymerisation inhibition, tnnt2a MO and jagged1b MO) and (4) inhibitors of angiogenic factors (myosin II inhibition, jagged1a MO, ccbe1 MO and VEGF inhibition).

Comparing regional similarity and left-right symmetry. (A) ROI selection allows comparison of vascular parameters in the midbrain (dotted line) and hindbrain (solid line). (B) Comparing the midbrain to the hindbrain, network length was not statistically significantly different (P=0.6168, n=10, unpaired two-tailed Student's t-test; data are mean±s.d.). (C) The average vessel radius was statistically significantly higher in the hindbrain (P=0.0008, n=10, unpaired two-tailed Student's t-test; data are mean±s.d.). (D) The number of junctions was not statistically significantly different (P=0.0717, n=10, unpaired two-tailed Student's t-test; data are mean±s.d.). (E) Vascular volume was not statistically significantly different (P=0.3698, n=10, unpaired two-tailed Student's t-test; data are mean±s.d.). (F) ROI selection allows comparison of vascular parameters in the right (broken line) and left (solid line) brain hemisphere. (G) Comparing the left and right vasculature, network length was not statistically significantly different (P=0.6830, n=10, unpaired two-tailed Student's t-test; data are mean±s.d.). (H) The average vessel radius was not statistically significantly different (P=0.5665, n=10, unpaired two-tailed Student's t-test; data are mean±s.d.). (I) The number of junctions was not statistically significantly different (P=0.8816, n=10, unpaired two-tailed Student's t-test; data are mean±s.d.). (J) Vascular volume was not statistically significantly different (P=0.5730, n=10, unpaired two-tailed Student's t-test; data are mean±s.d.). (K) Manual selection of left-right body axis (magenta) in segmented template fish used for image rotation and left-right separation in registered segmented images. (L) Image rotation was performed to align sample anterior-posterior axis with image x-axis. (M) Right vascular volume was mirrored and vascular volume quantified for the left and right vasculature. (N,O) Similarity measures were extracted to compare left and mirrored right vasculature. (P) Left and right vascular network lengths were quantified after skeletonisation to extract vascular centrelines (representative images). (Q) MIPs of left (green) and right (magenta) vasculature, showing regions of similarity (white). (R) Representative micrographs of regions of left-right vascular overlap from one example fish. (S) Schematics showing left-right symmetric vessels from 2 to 5 dpf. (T) Cranial vascular volume was found to statistically significantly increase from 2 to 5 dpf (****P<0.0001), while no statistically significant difference was found between the vascular volume of the left (L) and right (R) brain hemispheres (L-R; 2 dpf, P<0.9999, n=9 embryos; 3 dpf, P>0.9999, n=9 embryos; 4 dpf, P>0.9999, n=9 embryos; 5 dpf, P=0.9946, n=10 embryos; two experimental repeats; one-way ANOVA; data are mean±s.d.). (U) Cranial vascular network length was found to statistically significantly increase from 2 to 5 dpf (*P=0.0194), while no statistically significant L-R difference was found (L-R; 2 dpf, P<0.9999; 3 dpf, P>0.9999; 4 dpf, P>0.9999; 5 dpf, P>0.9999; n values as above; Kruskal–Wallis test; data are mean±s.d.). (V) The Dice co-efficient was not statistically significantly changed between the left and right vasculature from 2 to 5 dpf (P=0.8058; one-way ANOVA; 2 dpf, n=9 embryos; 3 dpf, n=9 embryos; 4 dpf, n=10 embryos; 5 dpf, n=10 embryos; data are from two experimental repeats; data are mean±s.d.).

Acknowledgments
This image is the copyrighted work of the attributed author or publisher, and ZFIN has permission only to display this image to its users. Additional permissions should be obtained from the applicable author or publisher of the image. Full text @ Development