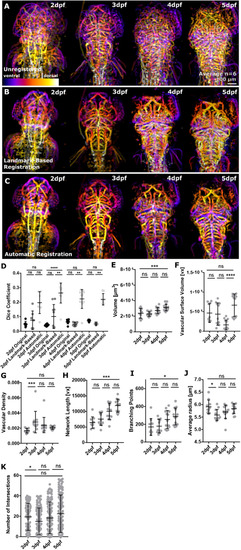
Application of ZVQ to embryos from 2 to 5 dpf to analyse vascular growth. (A) Depth-coded MIP showing regions of overlap (purple, ventral; white, dorsal) of six fish before registration from 2 to 5 dpf. (B) Depth-coded MIP showing regions of overlap (purple, ventral; white, dorsal) of six fish after manual registration from 2 to 5 dpf. (C) Depth-coded MIP showing regions of overlap (purple, ventral; white, dorsal) of six fish after automatic registration from 2 to 5 dpf. (D) Dice coefficient between template and moving image was increased after application of rigid registration using both anatomical landmark-based and automatic rigid registration from 2 to 5 dpf [2 dpf, n=7; 3 dpf, n=10; 4 dpf, n=10; 5 dpf, n=10; two experimental repeats; Kruskal–Wallis test; ns (P>0.5), **P=0.01-0.001, ****P<0.0001; data are mean±s.d.]. (E) Vascular volume was statistically significantly increased from 2 to 5 dpf (P=0.0008; 2 dpf, n=10; 3 dpf, n=12; 4 dpf, n=13; 5 dpf, n=15; one-way ANOVA; data are mean±s.d.). (F) Vascular surface was not statistically significantly increased from 2 to 5 dpf (P=0.4885; 2 dpf, n=10; 3 dpf, n=11; 4 dpf, n=13; 5 dpf, n=14; two experimental repeats; Kruskal–Wallis test; data are mean±s.d.). (G) Vascular density was not statistically significantly increased from 2 to 5 dpf (P=0.2041; 2 dpf, n=10; 3 dpf, n=11; 4 dpf, n=13; 5 dpf, n=14; two experimental repeats; Kruskal–Wallis test; data are mean±s.d.). (H) Network length was statistically significantly increased from 2 to 5 dpf (P=0.0001; 2 dpf, n=10; 3 dpf, n=12; 4 dpf, n=13; 5 dpf, n=15; Kruskal–Wallis test; mean±s.d.). (I) Branching points were statistically significantly increased from 2 to 5 dpf (P=0.0082; Kruskal–Wallis test; data are mean±s.d.). (J) Average vessel radius was not statistically significantly changed from 2 to 5 dpf (*P>0.9999; Kruskal–Wallis test; data are mean±s.d.). (K) Sholl analysis was conducted to assess vascular complexity, showing no significant increase from 2 to 5 dpf (2-3 dpf, *P=0.0340; 3-4 dpf, P=0.6825; 4-5 dpf P=0.2000; 2-5 dpf, n=5; Kruskal–Wallis test; data are mean±s.d.).
|
