FIGURE

Fig. 5.

ID
ZDB-FIG-220331-12
Publication
Kugler et al., 2022 - Zebrafish Vascular Quantification (ZVQ): a tool for quantification of three-dimensional zebrafish cerebrovascular architecture by automated image analysis
Other Figures
All Figure Page
Back to All Figure Page
Fig. 5.

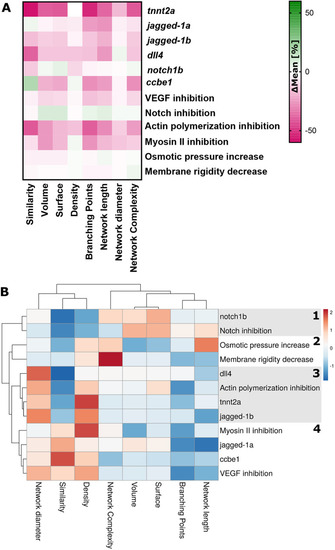
Quantification of vascular parameters and cluster analysis. (A) Percentage differences in mean values were quantified for the measured parameters (control MO to MO, and untreated to treated). (B) Cluster analysis identified four main clusters, including (1) inhibitors of anti-angiogenic factors (notch1b MO and Notch inhibition), (2) factors inducing cellular changes (osmotic pressure and membrane rigidity changes), (3) factors with severe angiogenic defects (dll4 MO, actin polymerisation inhibition, tnnt2a MO and jagged1b MO) and (4) inhibitors of angiogenic factors (myosin II inhibition, jagged1a MO, ccbe1 MO and VEGF inhibition).

Expression Data

Expression Detail
Antibody Labeling
Phenotype Data

Phenotype Detail
Acknowledgments
This image is the copyrighted work of the attributed author or publisher, and ZFIN has permission only to display this image to its users. Additional permissions should be obtained from the applicable author or publisher of the image. Full text @ Development