
Fig. 3.
- ID
- ZDB-FIG-220331-10
- Publication
- Kugler et al., 2022 - Zebrafish Vascular Quantification (ZVQ): a tool for quantification of three-dimensional zebrafish cerebrovascular architecture by automated image analysis
- Other Figures
- All Figure Page
- Back to All Figure Page
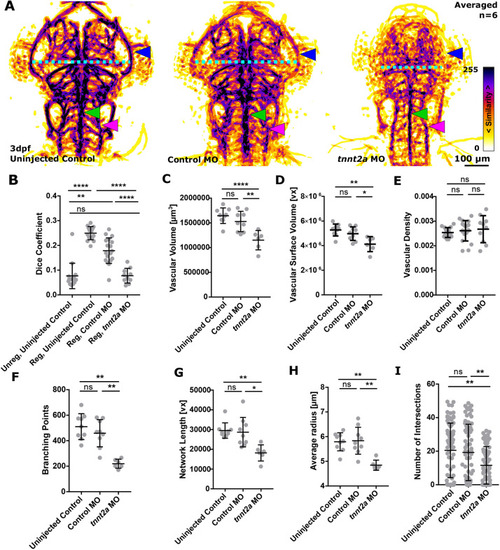
Absent blood flow reduces the cerebral vasculature. (A) MIPs of averaged data of six uninjected controls, control MO and tnnt2a MO following segmentation and registration, showing high inter-embryo similarity in midbrain vessel patterning [PMBC pattern (blue arrowhead), head size (PMBC′ to PMBC″ distance; cyan dotted line), BA (green arrowhead) and PHBC (magenta arrowhead)]. (B) A statistically significant decrease in the Dice coefficient was found when comparing registered control MO to tnnt2a MO (****P<0.0001; uninjected control=15, control MO=18, tnnt2a MO=10; Kruskal–Wallis test; data are mean±s.d.). (C) Vascular volume was statistically significantly decreased in tnnt2a MO (uninjected control, ****P<0.0001; control MO, ****P<0.0001; uninjected control=9, control MO=9, tnnt2a MO=6; one-way ANOVA; data are mean±s.d.). (D) Vascular surface was statistically significantly decreased in tnnt2a MO (uninjected control, P<0.0001; control MO, P=0.0007; Kruskal–Wallis test; data are mean±s.d.). (E) Vascular density was not statistically significantly changed in tnnt2a MO (uninjected control, P=0.6514; control MO, P=0.9082; one-way ANOVA; data are mean±s.d.). (F) Branching points were statistically significantly decreased in tnnt2a MO (uninjected control, P=0.0019; control MO, P=0.0092; Kruskal–Wallis test; data are mean±s.d.). (G) Vascular network length was statistically significantly decreased in tnnt2a MO (uninjected control, P=0.0033; control MO, P=0.0209; Kruskal–Wallis test; data are mean±s.d.). (H) Average vessel radius was statistically significantly decreased in tnnt2a MO (uninjected control, P=0.0050; control MO, P=0.0067; Kruskal–Wallis test; data are mean±s.d.). (I) Vascular complexity was statistically significantly decreased in tnnt2a MO (uninjected control, P=0.0050; control MO, P=0.0067; Kruskal–Wallis test; data are mean±s.d.). |