
- Title
-
Vascular endothelial growth factor-c regulates hematopoietic stem cell fate in the dorsal aorta
- Authors
- Schiavo, R.K., Tamplin, O.J.
- Source
- Full text @ Development
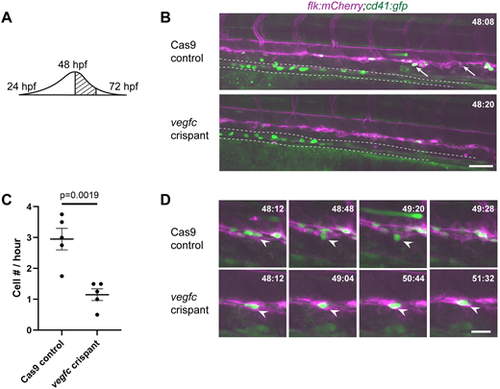
vegfc loss-of-function results in decreased HSPC emergence from the DA. (A) Schematic showing the wave of emergence from the DA; this experiment occurs during the peak. (B) Single frame of time-lapse (hpf:min) showing cd41:gfp+ (green) HSPCs (arrows) budding from flk:mCherry+ (magenta) HE in Cas9 control (top panel) or vegfc crispant embryos (bottom panel). Dotted line outlines developing pronephric tubules (see Movies 1 and 2). (C) Quantification of the total number of cd41:gfp+ HSPCs budding from the DA between 48 and 52 hpf, divided by four to give cell number (#) per hour. n=5 embryos per condition, P=0.0019 (unpaired two-tailed t-test). (D) Four frames selected from Cas9 control and vegfc crispant time-lapse movies depicting HSPC budding (top panels) and a static hammock-like cell (bottom panels). White arrowheads indicate the cell of interest. Error bars show mean±s.e.m. Scale bars: 50 µm (B); 10 µm (D). |
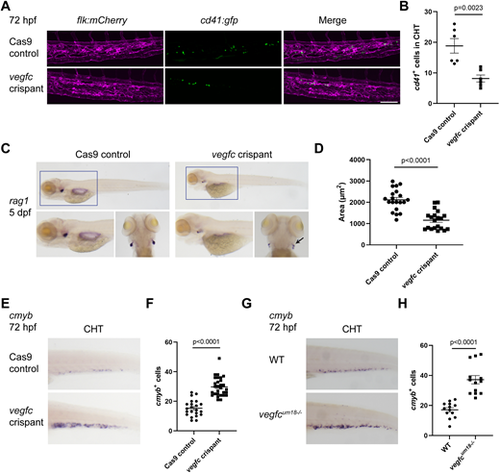
vegfc loss-of-function leads to altered definitive hematopoiesis throughout development. (A) In vivo imaging of cd41:gfp (green; HSPCs) and flk:mCherry (magenta; vessels) depicting decreased HSPC numbers in the CHT of vegfc loss-of-function embryos at 72 hpf. (B) Quantification of cd41:gfp+ cells within the CHT, as shown in A; Cas9 control versus vegfc crispants, P=0.0023 (unpaired two-tailed t-test). (C) vegfc crispants show decreased area of rag1 expression in the thymus at 5 dpf. Black arrow highlights area of rag1 staining in vegfc crispant. (D) Quantification of the area of rag1 expression, P<0.0001 (unpaired two-tailed t-test). (E) vegfc loss-of-function increases the number of cmyb-expressing cells in the CHT compared with Cas9 control embryos. (F) Quantification of the number of cmyb-expressing cells in the CHT at 72 hpf, P<0.0001 (unpaired two-tailed t-test). (G) vegfcum18−/− mutant embryos show an increased number of cmyb-expressing cells in the CHT at 72 hpf. (H) Number of cmyb-expressing cells in the CHT at 72 hpf, P<0.0001 (unpaired two-tailed t-test). Error bars show mean±s.e.m. Scale bar: 40 µm (A). |
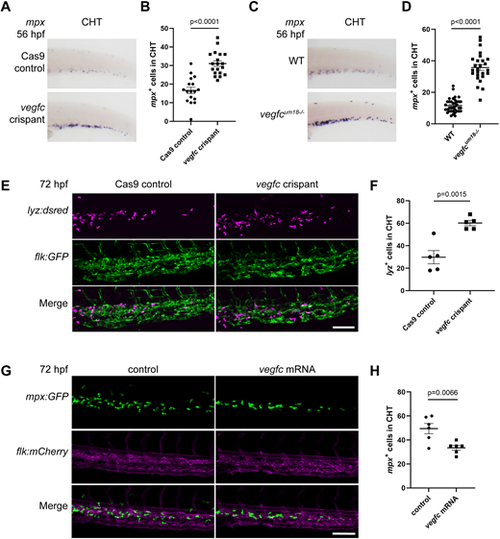
vegfc loss-of-function embryos display an increase in myeloid cells in the CHT. (A) vegfc loss-of-function increases the number of mpx-expressing cells in the CHT region at 56 hpf. (B) Quantification of the number of mpx-expressing cells in the CHT at 56 hpf, P<0.0001 (unpaired two-tailed t-test). (C) vegfcum18−/− mutant embryos show increased mpx expression in the CHT at 56 hpf. (D) Quantification of the number of mpx-expressing cells in the CHT at 72 hpf, P<0.0001 (unpaired two-tailed t-test). (E) vegfc loss-of-function increases the number of lyz:DsRed2+ (magenta) cells in the CHT at 72 hpf. flk:gfp+ vessels are green. (F) Quantification of lyz:DsRed2+ cells within the CHT, P=0.0015 (unpaired two-tailed t-test). (G) Overexpression of vegfc decreases the number of mpx:gfp+ (green) cells in the CHT at 72 hpf. flk:mCherry+ vessels are magenta. (H) Quantification of the number of mpx-expressing cells in the CHT at 72 hpf, P=0.0066 (unpaired two-tailed t-test). Error bars show mean±s.e.m. Scale bars: 50 µm (E,G). |
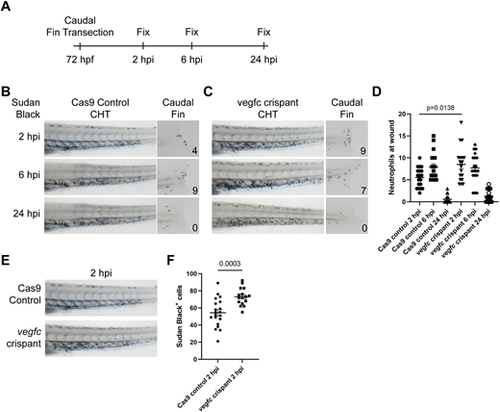
vegfc loss-of-function embryos show altered injury response. (A) Experimental approach. Caudal fins were transected distally without injury of the notochord at 72 hpf. Embryos were fixed in 4% PFA at different intervals following transection. (B) Bright-view images of Sudan Black staining in Cas9 control embryos depicting neutrophil response at 2, 6 and 24 hpi. Neutrophil response peaks at 6 hpi and subsides by 24 hpi. (C) Bright-view images of Sudan Black staining in vegfc loss-of-function embryos. Neutrophil response peaks at 2 hpi and diminishes over time. (D) Quantification of neutrophil number within the injury area, P=0.0138 (comparison between Cas9 control 2 hpi and vegfc crispant 2 hpi; one-way ANOVA). (E) Representative images showing increased neutrophils within the CHT of vegfc loss-of-function embryos at 2 hpi. (F) Quantification of the number of Sudan Black-positive neutrophils within the CHT at 2 hpi, P=0.0003 (unpaired two-tailed t-test). Error bars show mean±s.e.m. |
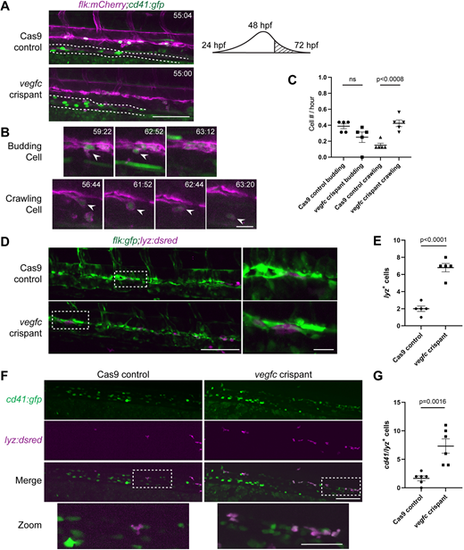
Late-stage hemogenic endothelium in vegfc loss-of-function embryos gives rise to increased crawling myeloid-like cells. (A) Single frames of cd41:gfp+ (green) and flk:mCherry+ (magenta) time-lapse (hpf:min) showing the overall difference in DA morphology between Cas9 controls (top panel) and vegfc crispants (bottom panel). The dotted line outlines the pronephric tubules. Right shows a schematic showing the time window of imaging for this experiment that is past the peak of HSPC emergence form the DA. (B) Three frames selected from Cas9 control time-lapse movie (Movie 3) between 56-72 hpf depicting HSPC budding (top). Four frames selected from vegfc crispant time-lapse movie (Movie 4) depicting HSPC crawling (bottom). White arrowheads indicate the cell of interest. (C) Quantification of cd41:gfp+/flk:mCherry+ cell behavior within the DA, P<0.0008 (control versus crispant, budding or crawling; one-way ANOVA). The total number of events observed are divided by the duration of the experiment (16 h) to give the number of events per hour. The data shown is from one experiment with a total of n=5 control and n=5 vegfc crispant embryos. (D) Single frames of flk:gfp+/lyz:DsRed2+ time-lapse (hpf:min) showing the overall number of lyz:DsRed2+ cells within the DA of Cas9 controls (top panel) and vegfc crispants (bottom panel). Right panels show magnification of boxed areas on left. (E) Quantification of the number of resident lyz:DsRed2+ cells within the ventral wall of the DA, P<0.0001 (unpaired two-tailed t-test). (F) vegfc crispants show increased cd41:gfp+/lyz:DsRed2+ cells in the DA at 56 hpf. Bottom panel shows magnified image of double-positive cells (boxed area above). (G) Quantification of the number of cd41:gfp+/lyz:DsRed2+ cells within the DA, P=0.0016 (unpaired two-tailed t-test). Error bars show mean±s.e.m. Scale bars: 40 µm (A); 10 µm (B, D magnification); 100 µm (D,F); 50 µm (F magnification). |

Chemical inhibition of Vegf family receptors phenocopies vegfc loss-of-function. (A) Experimental schematic showing SU5416 dosage starting at 32 hpf, followed by time-lapse imaging from 48 to 52 hpf. The hatched area indicates the time-lapse window, and the gray area indicates the time of SU5416 treatment. (B) Treatment of embryos with SU5416 created high levels of autofluorescence in the yolk sac. Therefore, we present images with levels (brightness and contrast) optimized for GFP signal in DMSO-treated control embryos (left column) and SU5416-treated embryos (right column). Single frames of the time-lapse (hpf:min) show cd41:gfp+ HSPCs (green) budding from the flk:mCherry+ DA (magenta) (Movie 9). White arrows indicate cells undergoing EHT. Compared with DMSO controls (top panels), there are very few budding HSPCs in SU5416-treated embryos (bottom panels) (Movie 10). Dotted lines outline pronephric tubules. (C) Quantification of the total number of cd41:gfp+ HSPCs budding from the DA between 48 and 52 hpf. The total number of events observed are divided by the duration of the experiment (4 h) to give the number of events per hour. The data shown is from one experiment with n=5 DMSO- and n=5 SU5416-treated embryos. P=0.0002 (unpaired two-tailed t-test). (D) In vivo imaging of the CHT in cd41:gfp/flk:mCherry embryos at 72 hpf, after treatment with SU5416 from 32 hpf, shows a reduction in HSPC numbers. (E) Quantification of cd41:gfp+ cells within the CHT, as shown in D; DMSO control (n=11) versus SU5416-treated (n=12). P=0.0001 (unpaired two-tailed t-test). (F) Treatment with SU5416 increases the percentage of embryos with high cmyb expression compared with DMSO-treated embryos. cmyb expression was scored in the CHT at 72 hpf. (G) Percentage of total embryos scored and classified as having low or high cmyb expression, P=6.73×10⁻⁶ (chi-square goodness of fit test). (H) Treatment with SU5416 increases the percentage of embryos with high mpx expression compared with DMSO controls. (I) Percentage of total embryos scored and classified as having low or high mpx expression, P=4.06×10⁻⁸ (chi-square goodness of fit test). SU5416 dose is 0.75 µM in DMSO. Scale bars: 50 µm (B,D). |
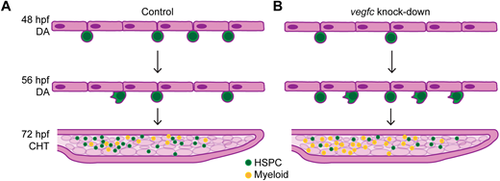
Model of Vegfc function in determining HE fate decisions in the DA. (A) Schematic of HSPC development in control embryos. Emergence of nascent HSPCs from the DA peaks at 48 hpf. In late stage EHT (56 hpf and later) there is a decrease in HSPC emergence and the appearance of few crawling cells. HSPCs then colonize the CHT, where there are also myeloid cells present. (B) Schematic of HSPC development in vegfc loss-of-function embryos. There are significantly fewer HSPCs during the peak of emergence from the DA. In late stage EHT there is a change in cell behavior and many crawling cells emerge from the DA. In the CHT there are decreased HSPCs and an increased number of myeloid cells |