
Fig. 5
- ID
- ZDB-FIG-231215-119
- Publication
- Schiavo et al., 2021 - Vascular endothelial growth factor-c regulates hematopoietic stem cell fate in the dorsal aorta
- Other Figures
- All Figure Page
- Back to All Figure Page
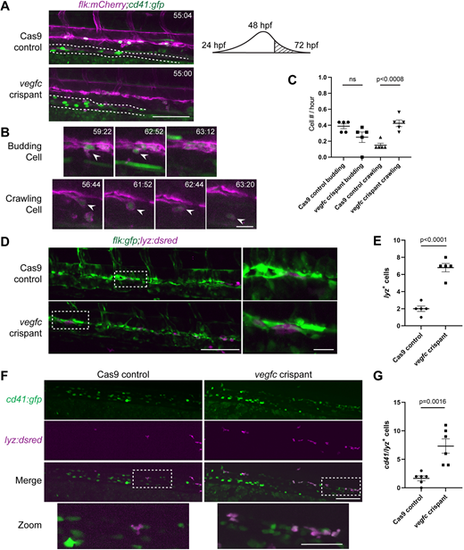
Late-stage hemogenic endothelium in vegfc loss-of-function embryos gives rise to increased crawling myeloid-like cells. (A) Single frames of cd41:gfp+ (green) and flk:mCherry+ (magenta) time-lapse (hpf:min) showing the overall difference in DA morphology between Cas9 controls (top panel) and vegfc crispants (bottom panel). The dotted line outlines the pronephric tubules. Right shows a schematic showing the time window of imaging for this experiment that is past the peak of HSPC emergence form the DA. (B) Three frames selected from Cas9 control time-lapse movie (Movie 3) between 56-72 hpf depicting HSPC budding (top). Four frames selected from vegfc crispant time-lapse movie (Movie 4) depicting HSPC crawling (bottom). White arrowheads indicate the cell of interest. (C) Quantification of cd41:gfp+/flk:mCherry+ cell behavior within the DA, P<0.0008 (control versus crispant, budding or crawling; one-way ANOVA). The total number of events observed are divided by the duration of the experiment (16 h) to give the number of events per hour. The data shown is from one experiment with a total of n=5 control and n=5 vegfc crispant embryos. (D) Single frames of flk:gfp+/lyz:DsRed2+ time-lapse (hpf:min) showing the overall number of lyz:DsRed2+ cells within the DA of Cas9 controls (top panel) and vegfc crispants (bottom panel). Right panels show magnification of boxed areas on left. (E) Quantification of the number of resident lyz:DsRed2+ cells within the ventral wall of the DA, P<0.0001 (unpaired two-tailed t-test). (F) vegfc crispants show increased cd41:gfp+/lyz:DsRed2+ cells in the DA at 56 hpf. Bottom panel shows magnified image of double-positive cells (boxed area above). (G) Quantification of the number of cd41:gfp+/lyz:DsRed2+ cells within the DA, P=0.0016 (unpaired two-tailed t-test). Error bars show mean±s.e.m. Scale bars: 40 µm (A); 10 µm (B, D magnification); 100 µm (D,F); 50 µm (F magnification). |