FIGURE SUMMARY
Title

Identification of ACTA2 as a Key Contributor to Venous Malformation

Authors
Wang, S., Zhou, Z., Li, J., Wang, Y., Li, H., Lv, R., Xu, G., Zhang, J., Bi, J., Huo, R.
Source
Full text @ Front Cell Dev Biol

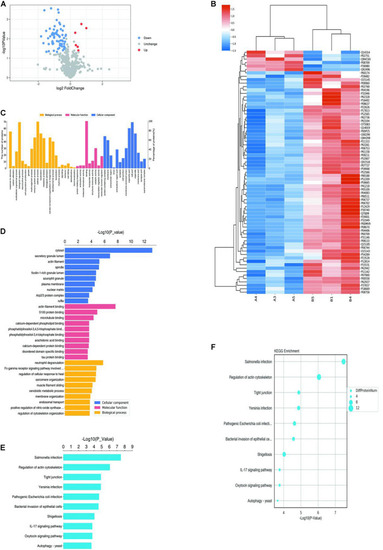
Proteomics and bioinformatics analysis of proteins involved in VM. (A) Volcano plots for the differential expression of proteins between VM and the control group (Red—high expression; blue—low expression). (B) Heatmap for the differential expression of proteins between VM and control group (Red indicates high expression; blue indicates low expression). (C) Gene Ontology (GO) functional annotation analysis of differentially expressed proteins. (D) GO functional enrichment analysis of differentially expressed proteins. (E) KEGG functional enrichment analysis of differentially expressed proteins. (F) KEGG functional enrichment analysis bubble diagram of differentially expressed proteins.

HCS screening identified ACTA2 as a critical gene in promoting VM proliferation. (A,B) A total of 20 genes were selected for validation by high-content screening. PC: positive control siRNA targeting b-actin. (C) Representative fluorescence images of high-content siRNA screening for ACTA2.

Lower expression of ACTA2 in VM tissues. (A,B) The RNA expression level of ACTA2 in 7 pairs of normal and VM tissues. (C) Western blotting shows ACTA2 protein expression in 7 pairs of normal and VM tissues. (D) Light (up) and fluorescence (down) microscopy images confirming successful transduction of HMEC1 with LV-ACTA2(27000-1) virus and the control group. (E) ACTA2 expression levels were assessed by real-time RT-PCR, with GAPDH as an internal control. (F) ACTA2 expression levels were assessed by Western blotting. *P < 0.05, **P < 0.01, ***P < 0.0001.

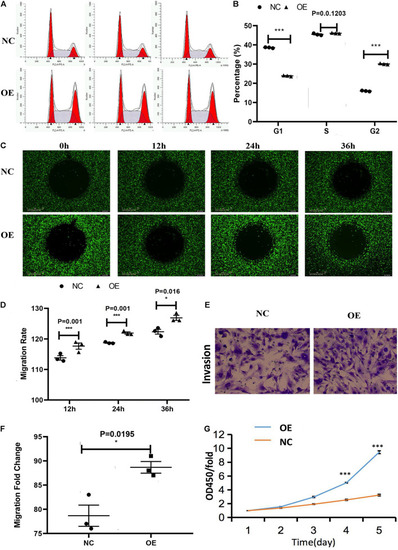
Effect of the overexpression of ACTA2 on the migration and invasion ability of HMEC-1. (A,B) Cell cycle distribution was determined by flow cytometry after propidium iodide (PI) staining. (C,D) OrisTM plate Wound-healing assay for the migration of HMEC1 after ACTA2 overexpressing. (E,F) Invasion assay for the invasion of HMEC1 after ACTA2 overexpressing. (G) CCK-8 assay for the proliferation of HMEC1 after ACTA2 overexpressing. *P < 0.05, **P < 0.01, ***P < 0.0001.

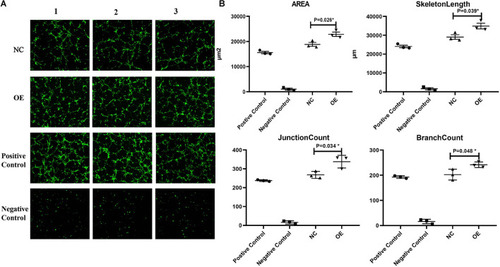
Effect of overexpression of ACTA2 on angiogenesis. (A) Representative fluorescence images of angiogenesis in the positive control, negative control, NC, and ACTA2 overexpressing group. (B) Quantification of Area, Skeleton Length, Junction Count, Branch Count of positive control, negative control, NC and ACTA2 overexpressing group. *P < 0.05, **P < 0.01, ***P < 0.0001.

Effectiveness of acta2 knockdown was confirmed by RT-PCR and qRT-PCR. (A) The zebrafish acta2 gene was targeted by specific morpholino antisense to prevent proper splicing of exon 2 (E2I2-MO). (B) RT-PCR of acta2 transcript from control-MO and E2I2-MO morpholino-injected embryos 2 days after fertilization, demonstrating insertion of intron 2 and skipping of exon 2. (C,E) Sanger sequencing of both the wild type band and the intron 2-inserted band and the exon 2-skipped band validating the wild type sequence and the intron 2-inserted sequence (C) and the exon 2-skipped sequence (E). (D) Quantitative measurements of acta2 expression levels measured by qRT-PCR (***P < 0.0001). MO-targeted down-regulation of acta2. dpf, days post-fertilization.

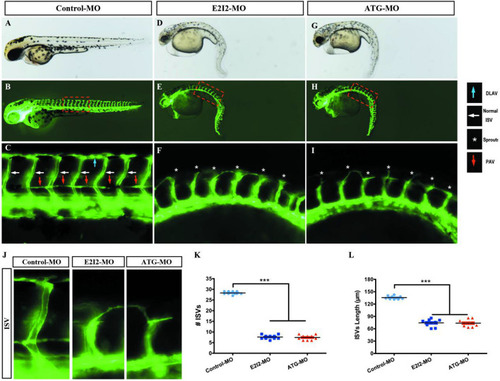
Morpholino knockdown of acta2 causes vascular defects. (A–I) Representative bright field and fluorescent images of Tg (fli1a:EGFP)y1 embryos at 50-hpf. (B,C,E–H) Image of trunk regions taken at 50-hpf, with the vascular structures visualized by eGFP fluorescence and labeled ISV (intersegmental vessel) and DLAV (dorsal longitudinal anastomotic vessel) showed regular development in the embryo injected with control MO. Compared with control MO, embryos injected with acta2-MO present a lower number of incomplete ISVs and ectopic sprouts (F,I, asterisk). In control embryos, the parachordal vessels (PAV) form normally (C, red arrows). Compared with control, MO knockdown acta2 prevents the parachordal vessels (PAV) formation, the precursor to the lymphatic system. The boxed regions are shown at higher magnification in the bottom panels. (J–L) Quantification of the number of complete ISVs or mean length of ISVs shows a significantly decrease in acta2 morphants. Columns, mean; SEM (n = 10; ANOVA) ***P < 0.0001. hpf, hours post-fertilization.

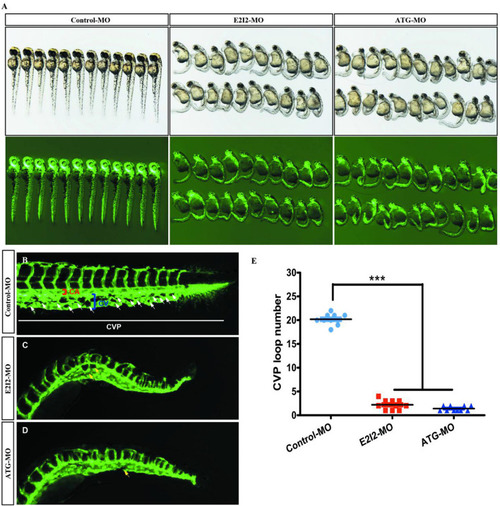
Acta2 knockdown impairs formation of the CVP in zebrafish. (A) In control embryos, caudal vein plexus (CVP) were formed honeycomb-like structures at the tail around 50 h post-fertilization (hpf). (B–D) Acta2 knockdown resulted in specific defects in CVP formation. (E) Quantification of loop number at CVP. Columns, mean; SEM (n = 10; ANOVA) *P < 0.05, **P < 0.01, ***P < 0.0001. CVP, caudal vein plexus; CA, caudal artery; CV, caudal vein.

(A) Endogenous dll4, notch1a, notch1b, hey2, efnb2a, ptp-rb, cd146, nr2f1a, s1pr1 and s1pr2 in control and acta2 morphants assessed by qRT-PCR (n = 6–10 individual embryos). *** P < 0.001; ns, not significant. (B) Endogenous shha, ptch2, smo, Sufu, Gli1, Gli2a, Gli2b, and Gli3 in control and acta2 morphants assessed by qRT-PCR (n = 6–10 individual embryos). (C) Schematic model illustrating the MOA (mechanism of action) of acta2 in Zebrafish early development.

Acknowledgments
This image is the copyrighted work of the attributed author or publisher, and ZFIN has permission only to display this image to its users. Additional permissions should be obtained from the applicable author or publisher of the image. Full text @ Front Cell Dev Biol