FIGURE

FIGURE 5

ID
ZDB-FIG-211207-5
Publication
Wang et al., 2021 - Identification of ACTA2 as a Key Contributor to Venous Malformation
Other Figures
All Figure Page
Back to All Figure Page
FIGURE 5

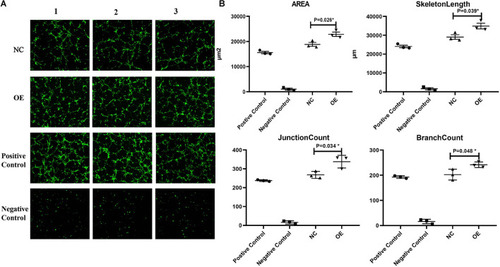
Effect of overexpression of ACTA2 on angiogenesis. (A) Representative fluorescence images of angiogenesis in the positive control, negative control, NC, and ACTA2 overexpressing group. (B) Quantification of Area, Skeleton Length, Junction Count, Branch Count of positive control, negative control, NC and ACTA2 overexpressing group. *P < 0.05, **P < 0.01, ***P < 0.0001.

Expression Data

Expression Detail
Antibody Labeling
Phenotype Data

Phenotype Detail
Acknowledgments
This image is the copyrighted work of the attributed author or publisher, and ZFIN has permission only to display this image to its users. Additional permissions should be obtained from the applicable author or publisher of the image. Full text @ Front Cell Dev Biol