
Image
|
Figure Caption
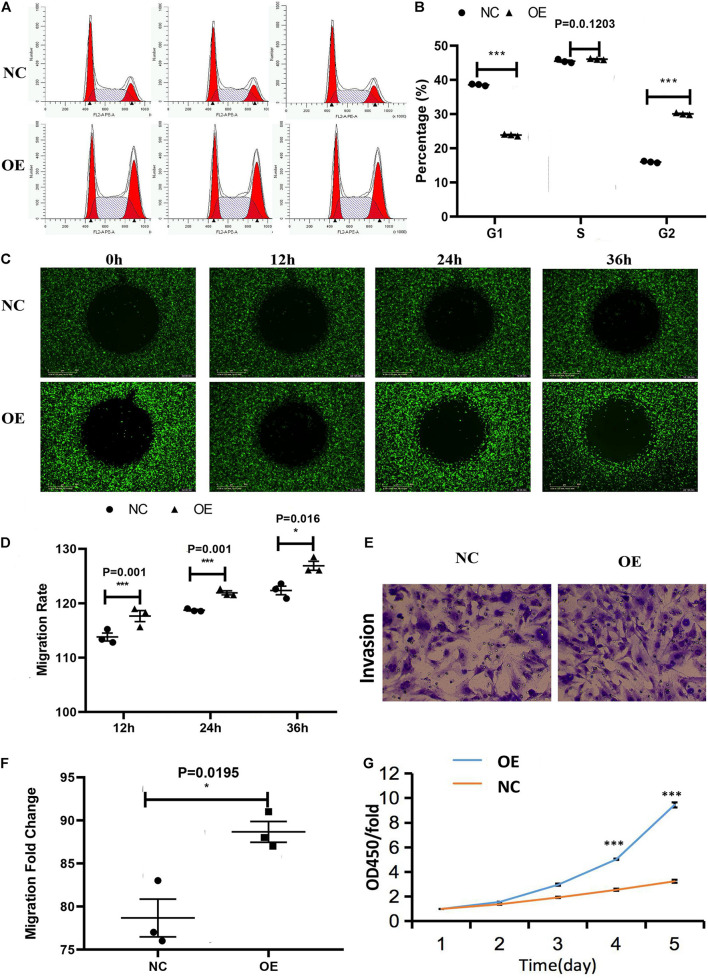
FIGURE 4
Effect of the overexpression of ACTA2 on the migration and invasion ability of HMEC-1. (A,B) Cell cycle distribution was determined by flow cytometry after propidium iodide (PI) staining. (C,D) OrisTM plate Wound-healing assay for the migration of HMEC1 after ACTA2 overexpressing. (E,F) Invasion assay for the invasion of HMEC1 after ACTA2 overexpressing. (G) CCK-8 assay for the proliferation of HMEC1 after ACTA2 overexpressing. *P < 0.05, **P < 0.01, ***P < 0.0001.
Acknowledgments
This image is the copyrighted work of the attributed author or publisher, and
ZFIN has permission only to display this image to its users.
Additional permissions should be obtained from the applicable author or publisher of the image.
Full text @ Front Cell Dev Biol