
- Title
-
Knockout of mafba Causes Inner-Ear Developmental Defects in Zebrafish via the Impairment of Proliferation and Differentiation of Ionocyte Progenitor Cells
- Authors
- Chen, X., Huang, Y., Gao, P., Lv, Y., Jia, D., Sun, K., Han, Y., Hu, H., Tang, Z., Ren, X., Liu, M.
- Source
- Full text @ Biomedicines
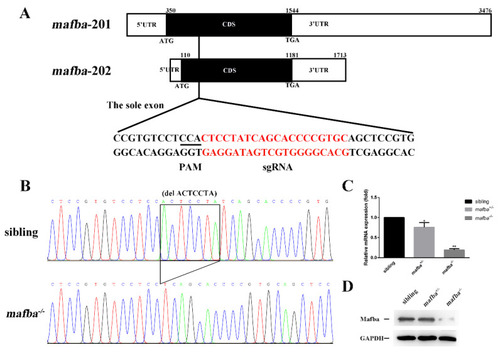
CRISPR/Cas9-mediated mutagenesis of mafba. (A) The sole exon of two mafba transcripts and the CRISPR/Cas9 target site are shown. The 5′UTR, CDS, and 3′UTR regions of the two mafba transcripts are shown in detail. (B) DNA sequencing identifies the c.298_304delACTCCTA mafba mutation lines. The 7-bp deletion is indicated with a black frame. (C) Relative expressions of mafba determined by qRT-PCR analysis in sibling, mafba+/−, and mafba−/− embryos at 4 dpf. The β-actin served as the endogenous control. Data are represented as mean ± SD; *, p < 0.05; **, p < 0.01. (D) Western blot analysis shows the similar protein expression of Mafba between siblings and mafba+/− embryos, but a significant decrease in mafba−/− mutants at 4 dpf. GAPDH was used as the internal control. |
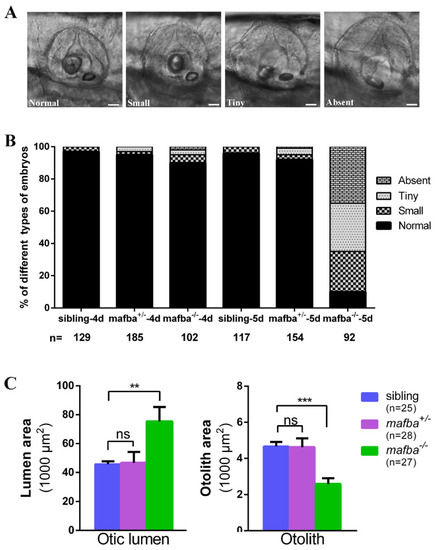
Deletion of mafba leads to inner-ear morphological defects. (A) The variable otolith sizes of mafba−/− mutant embryos at 5 dpf. According to the otolith sizes, mutant embryos were classified into four groups: normal, small, tiny, and absent. Scale bars: 40 µm. (B) Percentages of embryos in sibling and mafba−/− group at 4 dpf and 5 dpf; n, the number of observed embryos. (C) Statistical analysis of the otic lumen area and otolith area in different types of embryos at 5 dpf. Individual embryos were randomly picked from each type for statistical analysis. The otic lumen and otolith areas were measured with SPOT Advanced software (version 4.6) in the focal plane representing the maximal area. Data are represented as mean ± SD; ns, p > 0.05; **, p < 0.01; ***, p < 0.001. |
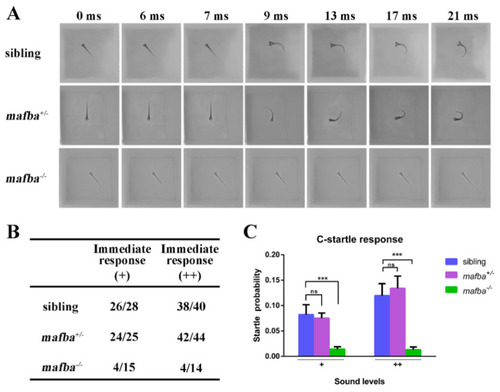
Hearing disability test for mafba−/− mutants at 5 dpf. (A) C-startle escape response of embryos of different genotypes in response to the sound stimuli at 500-Hz frequency and 10-ms duration. Typical C-startle escape response initiated within 9 ms after the sound stimulation. (B) Statistical data show the proportion of immediate responses in three genotypes at two different sound intensities. Data represent the number of immediate responses versus the number of total responses. ‘+’ and ‘++’ mean 20 dB and 40 dB, respectively. (C) The average C-startle response probability. For each group, 32 larvae were tested. Data are mean ± SD; ns, p > 0.05; ***, p < 0.001. |
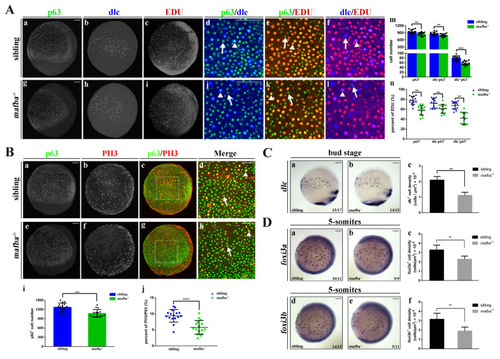
Knockout of mafba reduced the proliferation of epidermal stem cells and the dlc+ ionocyte progenitor cell number. (A) Examples of p63 with dlc or p63 with EDU or dlc with EDU colocalized (arrowhead) or non-colocalized (arrow) cells between sibling and mafba−/− groups are shown in (a–l). The quantitative analyses of the p63+ (marker for epidermal stem cells), dlc−p63+ (marker for keratinocyte precursors), and dlc+p63+ (marker for ionocyte precursors) cells in each group at the bud stage are shown in (m). The quantitative analyses of p63+, dlc−p63+, and dlc+p63+ cells colocalized with EDU (S-phase cells) in sibling and mafba−/− embryos at the bud stage are shown in (n). The n = 13 for each panel. Scale bars: 100 µm. (B) Double staining of p63 and pH3 (M-phase cells) in the siblings and mafba−/− group at the bud stage. Examples of p63 and pH3 colocalized (arrowhead) or non-colocalized (arrow) cells are shown. The quantitative analyses of p63+ cell and p63+ colocalized with pH3-positive cells of sibling and mafba−/− embryos at the bud stage are shown in (i) and (j), respectively. The n = 16 for each panel. Scale bars: 100 µm. (C) The dlc+ ionocyte progenitors’ cell density was reduced in the mafba−/− group (b) as compared to the sibling group (a) at the bud stage. The quantitative analysis of dlc+ ionocyte progenitors’ cell densities are shown in (c). (D) The cell density of foxi3a+ and foxi3b+ ionocyte progenitors are compared between the sibling (a,d) and mafba−/− group (b,e) at the 5-somites stage, respectively. Cell densities of foxi3a+ and foxi3b+ ionocyte progenitors are quantified in (c) and (f), respectively. Scale bars: 100 µm. Data are expressed as mean ± SD; **, p < 0.01; ***, p < 0.001; ****, p < 0.0001. |
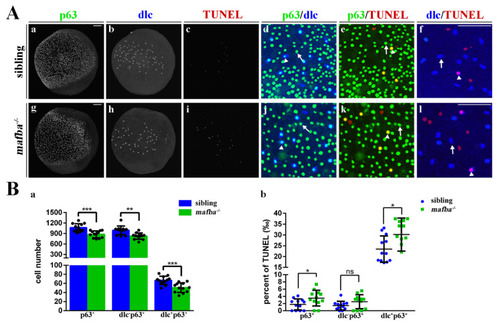
Increased apoptosis in the epidermal stem cells and dlc+ ionocyte progenitor cells of mafba−/− zebrafish. (A) Examples of p63 with dlc, p63 with TUNEL, or dlc with TUNEL colocalized (arrowhead) or non-colocalized (arrow) cells are shown. (B) The quantitative analyses of p63+ cells, dlc−p63+ cells, and dlc+p63+ cells of sibling and mafba−/− embryos at the bud stage are shown in (a). The quantitative analysis of p63+, dlc−p63+, and dlc+p63+ cell numbers colocalized with TUNEL in sibling and mafba−/− embryos at the bud stage are shown in (b). The n = 12 for each panel. Scale bars: 100 µm. Data are mean ± SD; ns, p > 0.05; *, p < 0.05; **, p < 0.01; ***, p < 0.001. |
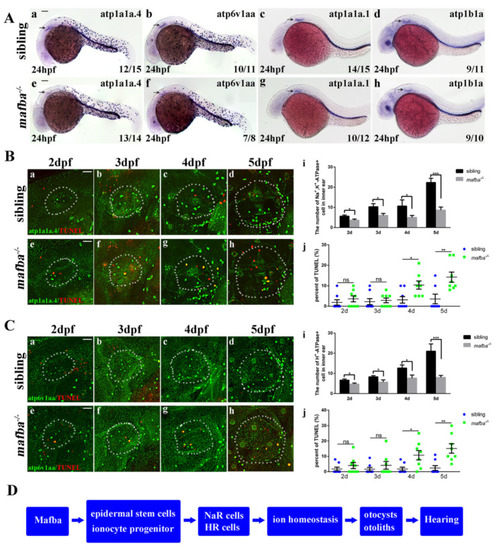
Mafba deprivation impaired ionocyte progenitor cell differentiation and triggered the apoptosis of NR and HR cells. (A) The in situ hybridization staining of markers for NR cells (atp1a1a.4, atp1a1a.1, atp1b1a) and for HR cells (atp6v1aa) at 24 hpf. The reductions in differentiated NR and HR cells in the inner-ear (arrow) region are shown. Scale bars: 100 µm. (B) Double immunostaining of atp1a1a.4 and TUNEL from 2 dpf to 5 dpf. The n = 8 for each panel. Scale bars: 20 µm (a–h). (i) The quantitative analysis of NR cells of the inner ear (the white, dotted, circled area) from 2 dpf to 5 dpf between sibling and mafba−/− mutants. (j) The percentage of the apoptosis in the NR cells from 2 dpf to 5 dpf indicated increased apoptosis at 4 dpf and 5 dpf in mafba−/− embryos’ inner-ear regions. (C) Double immunostaining of atp6v1aa and TUNEL from 2 dpf to 5 dpf. The n = 8 for each panel. Scale bars: 20 µm (a–h). (i) The quantitative analysis of HR cells of the inner-ear (the white, dotted, circled area) from 2 dpf to 5 dpf between sibling and mafba−/− mutants. (j) The quantification of the apoptosis percentage of NR cells from 2 dpf to 5 dpf indicates an increase at 4 dpf and 5 dpf in mafba−/− embryos’ inner-ear regions. Data are represented as mean ± SD; ns, p > 0.05; *, p < 0.05; **, p < 0.01; ***, p < 0.001. (D) A model of Mafba functions in zebrafish inner-ear development and hearing. |
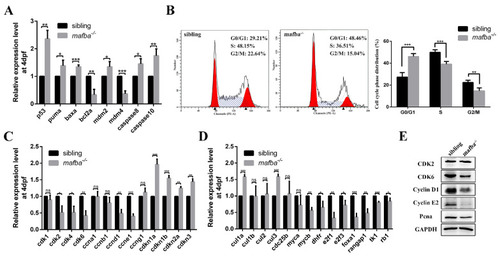
Mafba deficiency causes G0/G1 cell cycle arrest and activates the p53 pathway. (A) The upregulation of p53 pathway genes in mafba mutants at 4 dpf was detected by qRT-PCR. (B) The cell cycle phase distribution was performed by flow cytometry at 4 dpf. The proportion of sibling and mafba−/− embryos in the G0/G1, S, and G2/M phase cell numbers. The β-actin served as endogenous control. (C) Quantitative RT-PCR analysis of the primarily relevant cell cycle factors in sibling and mafba−/− mutant embryos at 4 dpf. (D) The key cell cycle factors controlling G1/S phase transition were analyzed via RT-qPCR at 4 dpf. (E) Western blot analysis of CDK2, CDK6, Cyclin D1, Cyclin E1, and Pcna at 4 dpf. GAPDH was used to normalize the protein. Data are mean ± SD; ns, p > 0.05; *, p < 0.05; **, p < 0.01; ***, p < 0.001 compared to the sibling control (by ANOVA followed by Dunnett’s multiple comparison). |
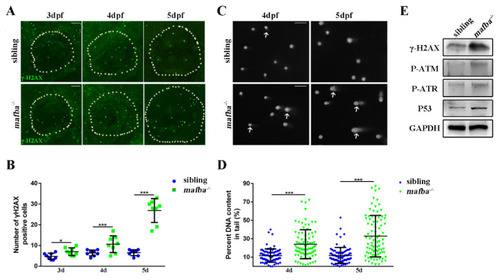
Analysis of the accumulation of DNA damage in mafba−/− mutants’ inner-ear. (A) Whole-mount immunofluorescence analysis using the anti-γH2AX antibody in siblings and mafba−/− inner-ear at 3, 4, and 5 dpf. The white, dotted circle represents the inner ear area. Scale bars: 20 µm. (B) Statistical analysis of the γH2AX-positive cells is shown in (A). (C) The alkaline comet assay showed increased DNA damage in mafba−/− embryos at 4 and 5 dpf. White arrows show DNA-damaged cells with single- or double-strand breaks. Scale bars: 10 µm. (D) Quantitative analysis of 88 cells from 10 embryos in siblings and mafba−/− group are shown. (E) Western blot analysis of γH2AX, P-ATM, P-ATR, and p53 in siblings and mafba−/− zebrafish at 4 dpf. GAPDH was used as the normalized protein control. Data are represented as mean ± SD; *, p < 0.05; ***, p < 0.001. |