
|
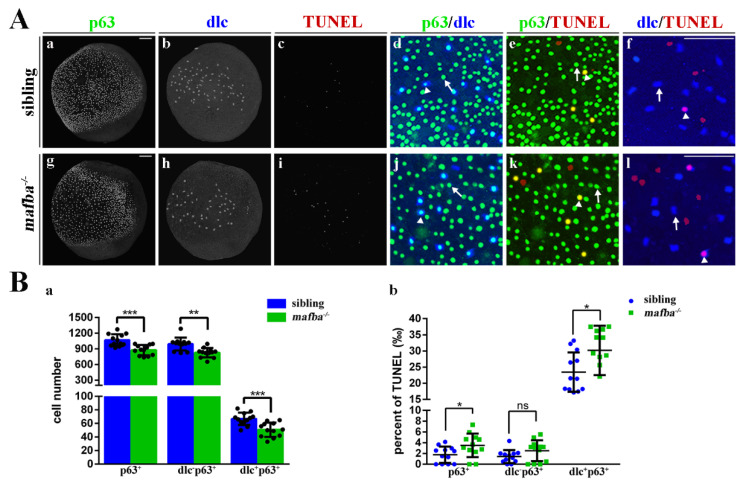
Figure 5
Increased apoptosis in the epidermal stem cells and dlc+ ionocyte progenitor cells of mafba−/− zebrafish. (A) Examples of p63 with dlc, p63 with TUNEL, or dlc with TUNEL colocalized (arrowhead) or non-colocalized (arrow) cells are shown. (B) The quantitative analyses of p63+ cells, dlc−p63+ cells, and dlc+p63+ cells of sibling and mafba−/− embryos at the bud stage are shown in (a). The quantitative analysis of p63+, dlc−p63+, and dlc+p63+ cell numbers colocalized with TUNEL in sibling and mafba−/− embryos at the bud stage are shown in (b). The n = 12 for each panel. Scale bars: 100 µm. Data are mean ± SD; ns, p > 0.05; *, p < 0.05; **, p < 0.01; ***, p < 0.001.