
|
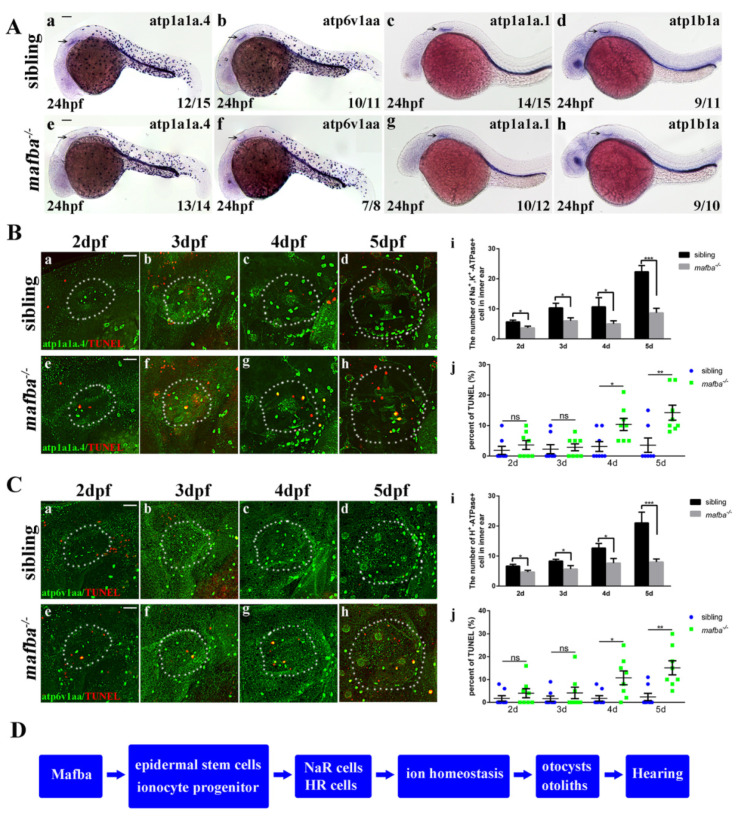
Figure 6
Mafba deprivation impaired ionocyte progenitor cell differentiation and triggered the apoptosis of NR and HR cells. (A) The in situ hybridization staining of markers for NR cells (atp1a1a.4, atp1a1a.1, atp1b1a) and for HR cells (atp6v1aa) at 24 hpf. The reductions in differentiated NR and HR cells in the inner-ear (arrow) region are shown. Scale bars: 100 µm. (B) Double immunostaining of atp1a1a.4 and TUNEL from 2 dpf to 5 dpf. The n = 8 for each panel. Scale bars: 20 µm (a–h). (i) The quantitative analysis of NR cells of the inner ear (the white, dotted, circled area) from 2 dpf to 5 dpf between sibling and mafba−/− mutants. (j) The percentage of the apoptosis in the NR cells from 2 dpf to 5 dpf indicated increased apoptosis at 4 dpf and 5 dpf in mafba−/− embryos’ inner-ear regions. (C) Double immunostaining of atp6v1aa and TUNEL from 2 dpf to 5 dpf. The n = 8 for each panel. Scale bars: 20 µm (a–h). (i) The quantitative analysis of HR cells of the inner-ear (the white, dotted, circled area) from 2 dpf to 5 dpf between sibling and mafba−/− mutants. (j) The quantification of the apoptosis percentage of NR cells from 2 dpf to 5 dpf indicates an increase at 4 dpf and 5 dpf in mafba−/− embryos’ inner-ear regions. Data are represented as mean ± SD; ns, p > 0.05; *, p < 0.05; **, p < 0.01; ***, p < 0.001. (D) A model of Mafba functions in zebrafish inner-ear development and hearing.