
|
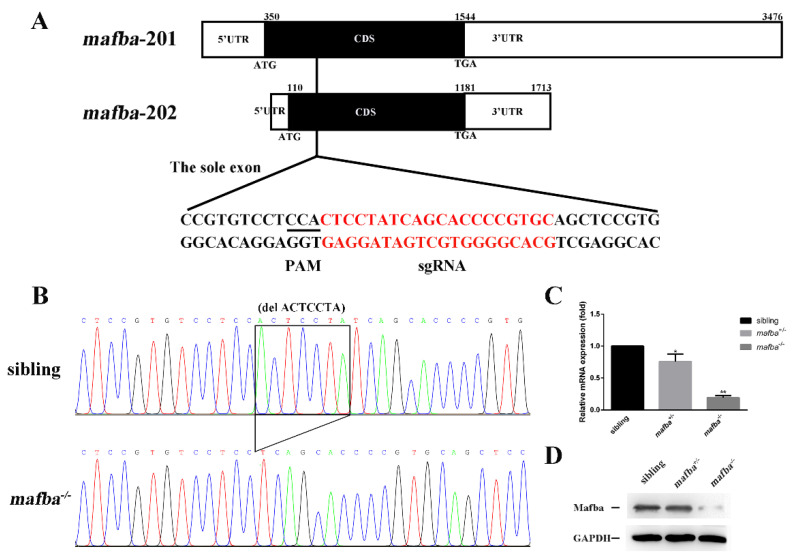
Figure 1
CRISPR/Cas9-mediated mutagenesis of mafba. (A) The sole exon of two mafba transcripts and the CRISPR/Cas9 target site are shown. The 5′UTR, CDS, and 3′UTR regions of the two mafba transcripts are shown in detail. (B) DNA sequencing identifies the c.298_304delACTCCTA mafba mutation lines. The 7-bp deletion is indicated with a black frame. (C) Relative expressions of mafba determined by qRT-PCR analysis in sibling, mafba+/−, and mafba−/− embryos at 4 dpf. The β-actin served as the endogenous control. Data are represented as mean ± SD; *, p < 0.05; **, p < 0.01. (D) Western blot analysis shows the similar protein expression of Mafba between siblings and mafba+/− embryos, but a significant decrease in mafba−/− mutants at 4 dpf. GAPDH was used as the internal control.