
- Title
-
Parp1 promotes sleep, which enhances DNA repair in neurons
- Authors
- Zada, D., Sela, Y., Matosevich, N., Monsonego, A., Lerer-Goldshtein, T., Nir, Y., Appelbaum, L.
- Source
- Full text @ Mol. Cell
Six hours of consolidated sleep are sufficient to normalize neuronal DNA damage.
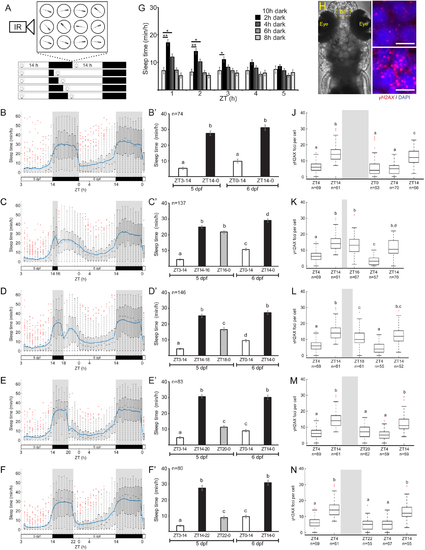
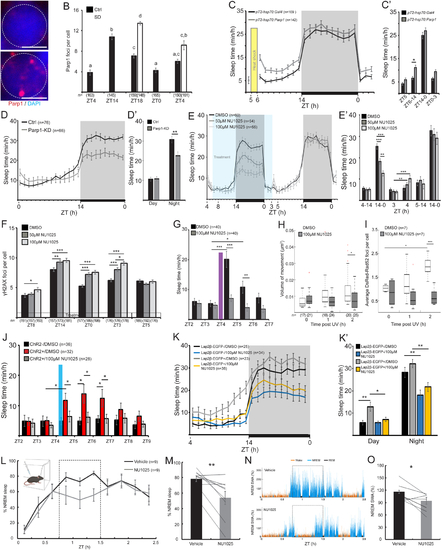
A. Schematic illustration of the experimental procedure. Sleep was monitored under various light/dark regimes. B-F’. Sleep of 5–6 dpf larvae under an 14 h light/ 10 h dark cycle (B, B’, p = 8×10−40), 14 h light/ 2 h dark cycle (C, C’, p = 3×10−94), 14 h light/ 4 h dark cycle (D, D’, p = 4×10−66), 14 h light/ 6 h dark cycle (E, E’, p = 1×10−83), 14 h light/ 8 h dark cycle (F, F’, p = 2×10−59). The bar charts represent the average sleep time for each time bin. G. Average sleep time of all groups in the first 5 h of the 2nd day. *p < 0.05, **p < 0.01, two-tailed t-test: two samples assuming unequal variance. H. Dorsal view of 6 dpf larvae. Dashed box showing the dorsal pallium (DP) area analyzed in J-N. I. Representative neuron nuclei stained with DAPI and γH2AX in the DP during the morning (ZT4) and the end of the day (ZT14). Scale bar = 5 μm. J-N. The levels of DNA damage in single neuronal nuclei over 34 h. All time points were compared to the baseline levels of the first day (5 dpf). J. 14 h light/10 h dark cycle, p = 1.9×10⁻³⁵. K. 14 h light/ 2 hr dark cycle, p = 1.8×10−39. L. 14 h light/ 4 h dark cycle, p = 2.2×10⁻³³. M. 14 h light/ 6 h dark cycle, p = 8.1×10−38. N. 14 h light/ 8 h dark cycle, p = 4.5×10−44. Letters indicate significant differences (p < 0.05), one-way ANOVA followed by Tukey’s test (B’-F’, J-N). Data show means ± SEM (B’-F’, G) or boxplots (B-F, J-N). Blue line represents mean. Red crosses indicate outliers. n=number of animals (B’-F’) or cells (J-N). ZT–zeitgeber time. |
Neuronal activity- and UV-induced DNA damage promote sleep.
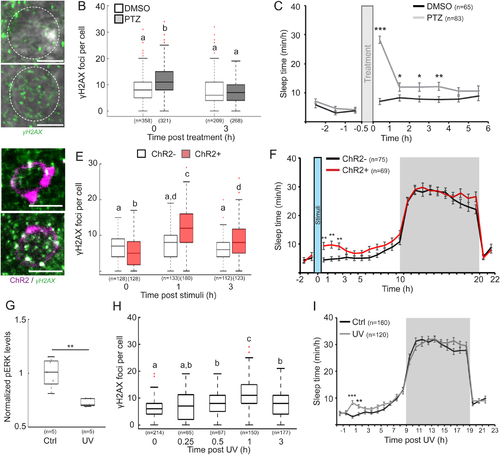
A. Representative images of γH2AX staining in neurons of the DP region of 6 dpf larvae immediately following 30 min of DMSO or PTZ treatment. Dashed circle indicates a single neuron. B. The levels of DNA damage in single nuclei immediately (0) and 3 h following DMSO or PTZ treatment. p = 1.3×10⁻⁹. C. Sleep before and after PTZ treatment in 6 dpf larvae. D. Representative images of γH2AX staining (green) in the DP region of tg(HuC:Gal4/uas:ChR2-mCherry) 6 dpf larvae expressing ChR2-mCherry (magenta) immediately and 1 h following 10 min of blue light stimuli. E. The levels of DNA damage in single neuronal nuclei. p = 2×10⁻²⁰. F. Sleep before and after 10 min of blue light stimuli in 6 dpf tg(HuC:Gal4)/tg(uas:ChR2-mCherry) (ChR2−) and tg(HuC:Gal4/uas:ChR2-mCherry) (ChR2+) larvae. G. Levels of α-pERK in the DP of 6 dpf larvae following 2 min exposure to purple (Ctrl) or UV light. H. The levels of DNA damage in single nuclei following 2 min UV exposure. p = 4.4×10⁻²⁸. I. Sleep prior and post 2 min exposure to ctrl or UV light. Data show mean ± SEM (C, F, I), or boxplots (B, E, G, H). Red crosses indicate outliers. *p < 0.05, **p < 0.01, ***p < 0.001. Letters indicate significant differences (p < 0.05), two-tailed t-test: two samples assuming unequal variance (C, F, G, I), one-way (H) or two-way (B, E) ANOVA followed by Tukey’s test. n=number of animals (C, F, G, I) or cells (B, E, H). Scale bar = 5 μm. |
Rad52- and ku80-repair activity is increased during sleep and post induction of DNA damage.
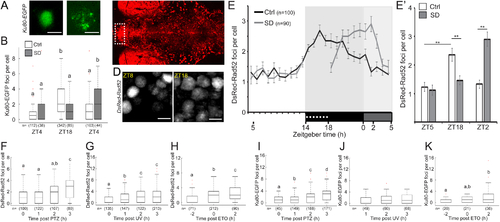
A. Representative images of HuC-driven Ku80-EGFP expression in neuron of 6 dpf larvae during day (ZT4) and night (ZT18). B. Number of Ku80-EGFP foci in single neurons under LD to constant darkness (LDD). p=1.1×10⁻¹⁶. C. Dorsal view of 6 dpf tg(HuC:Gal4/uas:DsRed-Rad52) larvae. Dashed box marks the dorsal pallium (DP). MB- midbrain. D. Representative images of the same DP region of 6 dpf tg(HuC:Gal4/uas:DsRed-Rad52) larvae during day (ZT8) and night (ZT18). E, E’. The number of DsRed-Rad52 foci in single neurons of the DP under LDD. **p < 0.01, two-tailed t-test: two samples assuming unequal variance. F-H. The number of DsRed-Rad52 foci in single nuclei following 30 min of PTZ treatment (F, p = 4.2×10⁻¹²), following 2 min UV exposure (G, p = 1.9×10⁻¹²), and before, immediately after, and following ETO treatment (H, p = 3.3×10⁻⁹). I-K. The number of Ku80-EGFP foci in single nuclei following 30 min of PTZ treatment (I, p = 3.6×10⁻¹³), following 2 min UV exposure (J), and before, immediately after, and following ETO treatment (K, p = 0.03). Data show mean ± SEM (B, E, E’), or boxplots (F-K). Red crosses indicate outliers. Letters indicate significant differences (p < 0.05), one-way (F-K) or two-way (B, E’) ANOVA followed by Tukey’s test. n-number of cells. ZT–zeitgeber time. Scale bar = 5 μm. |
Inhibition of chromosome dynamics reduces Rad52-repair activity and increases DNA damage and compensatory sleep.
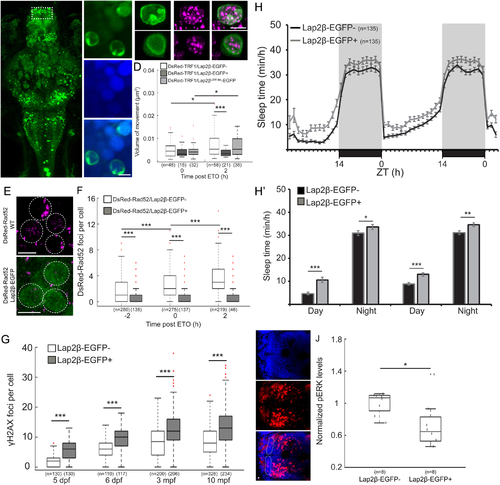
A. Dorsal view of 6 dpf tg(HuC:Gal4/uas:Lap2β-EGFP) larvae (Lap2β-EGFP+). Dashed box shows the dorsal pallium (DP). MB- midbrain, Rh- rhombencephalon. B. Representative image of Lap2β-EGFP expression in the nuclei. C. Co-expression of Lap2β-EGFP (green, upper panel) or Lap2βLEMdel-EGFP (green, lower panel) and chromosome marker (DsRed-TRF1, magenta) in the nucleus of DP neurons. D. Volume of chromosome dynamics during 5 min in neurons of the DP immediately and 2 h after ETO treatment. E. Neurons of the DP that express either DsRed-Rad52 or both DsRed-Rad52 and Lap2β-EGFP. F. The number of DsRed-Rad52 foci in the DP of 6 dpf larvae 2 h before, immediately after, and 2 h after ETO treatment. G. The levels of DNA damage in larvae and adult brains. H. H’. Sleep of 5–6 dpf larvae under a 14 h light/ 10 h dark cycle. H’. The average sleep time during the day and the night. I. Dorsal view (head points to the left) of the brain of 6 dpf larvae stained with α-pERK (red) and DAPI (blue). Dashed area marks the DP. J. Average pERK expression in single neurons of the DP of 6 dpf siblings. *p < 0.05, **p < 0.01, ***p < 0.001, two-tailed t-test: two samples assuming unequal variance (D, G-J), two-way ANOVA followed by Tukey’s test (F). Data show mean ± SEM (H, H’), or boxplots (D, F, G, J). Red crosses indicate outliers. n=number of animals (H, J) or cells (D, F, G). ZT-zeitgeber time. Scale bar = 5 μm. |
Parp1 regulates DNA damage-induced sleep.
A. Representative nuclei in DP neuron stained with DAPI and α-Parp1 at ZT4 and at the end of the day (ZT14). Dashed circle indicates a single neuron. Scale bar = 3 μm. B. The number of Parp1 foci in single DP neuronal nuclei. Letters indicate significant differences (p < 0.05). C. Sleep of 6–7 dpf pT2-hsp70:Parp1-injected and control pT2-hsp70:Gal4-injected larvae, before and following heat shock (see Figure S5C for Parp1 expression levels). C`. The average sleep time during portions of daytime and entire nighttime. D. Sleep of 6 dpf Parp1-KD larvae and their Ctrl siblings under a 14 h light/ 10 h dark cycle (see Figure S5C for Parp1 expression levels). D’. The average sleep time during the day and the night. E. Sleep of 5–6 dpf larvae under a 14 h light/ 10 h dark cycle, before, during (blue box), and following treatment with DMSO, 50 μM or 100 μM of the Parp1 inhibitor NU1025. È. The average sleep time during portions of daytime and entire nighttime. F. The number of γH2AX foci. G-I. Sleep time (G), chromosome dynamics in neurons of the DP (H, boxplots) and the average number of DsRed-Rad52 foci per larvae (I, boxplots) in 6 dpf DMSO- or NU1025-treated larvae before and following 2 min of UV radiation. J. Sleep of 6 dpf larvae before and following 10 min of blue light (480 nm) stimuli. K. K’. Sleep of 6 dpf Lap2β-EGFP+ and Lap2β-EGFP− siblings with either DMSO or 100 μM NU1025, under a 14 h light/ 10 h dark cycle. K’. The average sleep time during the day and night. L-O. Validation of the role of Parp1 in adult mice. L. Time course of percent time in NREM sleep in ZT0–2.5h after injection of parp1 inhibitor NU1025 or vehicle. Dashed rectangle marks the 0.75–1.5 h time interval used for quantitative comparison in M. Illustration embedded in top left depicts setup schematics. M. Percent time in NREM in individual subjects. N. Representative examples of frontal EEG slow wave activity (SWA) in ZT0–2.5 h (% of average NREM SWA per minute in baseline saline session of each animal) after injection of vehicle (top) and NU1025 (bottom) in the same subject. Dashed rectangle marks the 0.75–1.5 h time interval used for quantitative comparison in O. O. NREM SWA in individual subjects. Data show mean ± SEM. Lines (M, O) represent individual mouse data. *p < 0.05, **p < 0.01, ***p < 0.001. Two-tailed t-test: two samples assuming unequal variance (C’, D’, E’, F, G, J, K’), one-way (B), two-way (H, I) ANOVA followed by Tukey’s test, one-tailed sign-rank test (M, O). n-number of animals (C-E, G, J-L) or cells (B, F, H, I). ZT-zeitgeber time. |
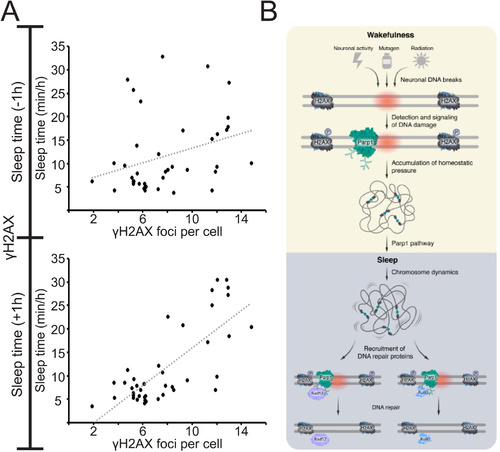
Proposed cellular mechanism for homeostatic regulation of sleep.
A. Plots of sleep time and γH2AX foci number (collection of data presented in Figures 1–5). Weak correlation (R = 0.3) between the amount of DNA damage and sleep time prior to the quantification of γH2AX foci (upper graph). Strong positive correlation (R = 0.76) between the amount of DNA damage and sleep time following the quantification of γH2AX foci (lower graph). This correlation suggests that the amount of the homeostatic driver – DNA damage – can predict the requirement of sleep time. Pearson correlation coefficient. B. During wakefulness, various processes, ranging from neuronal activity and radiation to mutagen activity, cause DNA damage in neurons (red circle). The DNA damage detector Parp1 is immediately recruited and activated in DNA loose ends, and soon after, the H2AX histone is phosphorylated (p). The accumulation of DNA damage is a homeostatic driver for sleep, and Parp1 activity and downstream pathways can mediate the signal to sleep. During sleep, chromosome dynamics increase, which enables the recruitment and efficient activity of the repair proteins Rad52 and Ku80 and their repair signaling pathways. Then, Parp1 is deactivated, the number of γH2AX is reduced, and the DNA damage-dependent homeostatic pressure to sleep is relieved. The duration and efficiency of this process may explain species-specific length and quality of sleep and repair (6 h in zebrafish larvae). |