
Fig. 5
- ID
- ZDB-FIG-230118-5
- Publication
- Zada et al., 2021 - Parp1 promotes sleep, which enhances DNA repair in neurons
- Other Figures
- All Figure Page
- Back to All Figure Page
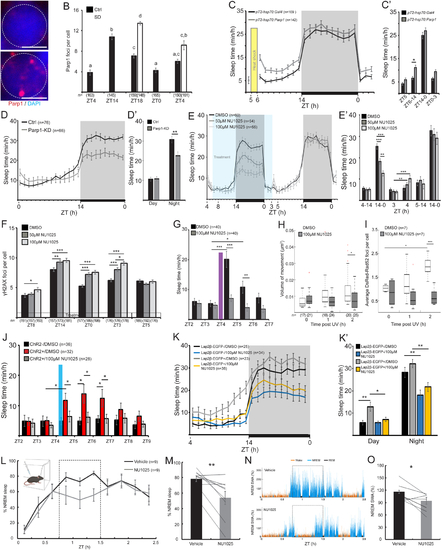
Parp1 regulates DNA damage-induced sleep.
A. Representative nuclei in DP neuron stained with DAPI and α-Parp1 at ZT4 and at the end of the day (ZT14). Dashed circle indicates a single neuron. Scale bar = 3 μm. B. The number of Parp1 foci in single DP neuronal nuclei. Letters indicate significant differences (p < 0.05). C. Sleep of 6–7 dpf pT2-hsp70:Parp1-injected and control pT2-hsp70:Gal4-injected larvae, before and following heat shock (see Figure S5C for Parp1 expression levels). C`. The average sleep time during portions of daytime and entire nighttime. D. Sleep of 6 dpf Parp1-KD larvae and their Ctrl siblings under a 14 h light/ 10 h dark cycle (see Figure S5C for Parp1 expression levels). D’. The average sleep time during the day and the night. E. Sleep of 5–6 dpf larvae under a 14 h light/ 10 h dark cycle, before, during (blue box), and following treatment with DMSO, 50 μM or 100 μM of the Parp1 inhibitor NU1025. È. The average sleep time during portions of daytime and entire nighttime. F. The number of γH2AX foci. G-I. Sleep time (G), chromosome dynamics in neurons of the DP (H, boxplots) and the average number of DsRed-Rad52 foci per larvae (I, boxplots) in 6 dpf DMSO- or NU1025-treated larvae before and following 2 min of UV radiation. J. Sleep of 6 dpf larvae before and following 10 min of blue light (480 nm) stimuli. K. K’. Sleep of 6 dpf Lap2β-EGFP+ and Lap2β-EGFP− siblings with either DMSO or 100 μM NU1025, under a 14 h light/ 10 h dark cycle. K’. The average sleep time during the day and night. L-O. Validation of the role of Parp1 in adult mice. L. Time course of percent time in NREM sleep in ZT0–2.5h after injection of parp1 inhibitor NU1025 or vehicle. Dashed rectangle marks the 0.75–1.5 h time interval used for quantitative comparison in M. Illustration embedded in top left depicts setup schematics. M. Percent time in NREM in individual subjects. N. Representative examples of frontal EEG slow wave activity (SWA) in ZT0–2.5 h (% of average NREM SWA per minute in baseline saline session of each animal) after injection of vehicle (top) and NU1025 (bottom) in the same subject. Dashed rectangle marks the 0.75–1.5 h time interval used for quantitative comparison in O. O. NREM SWA in individual subjects. Data show mean ± SEM. Lines (M, O) represent individual mouse data. *p < 0.05, **p < 0.01, ***p < 0.001. Two-tailed t-test: two samples assuming unequal variance (C’, D’, E’, F, G, J, K’), one-way (B), two-way (H, I) ANOVA followed by Tukey’s test, one-tailed sign-rank test (M, O). n-number of animals (C-E, G, J-L) or cells (B, F, H, I). ZT-zeitgeber time. |