
|
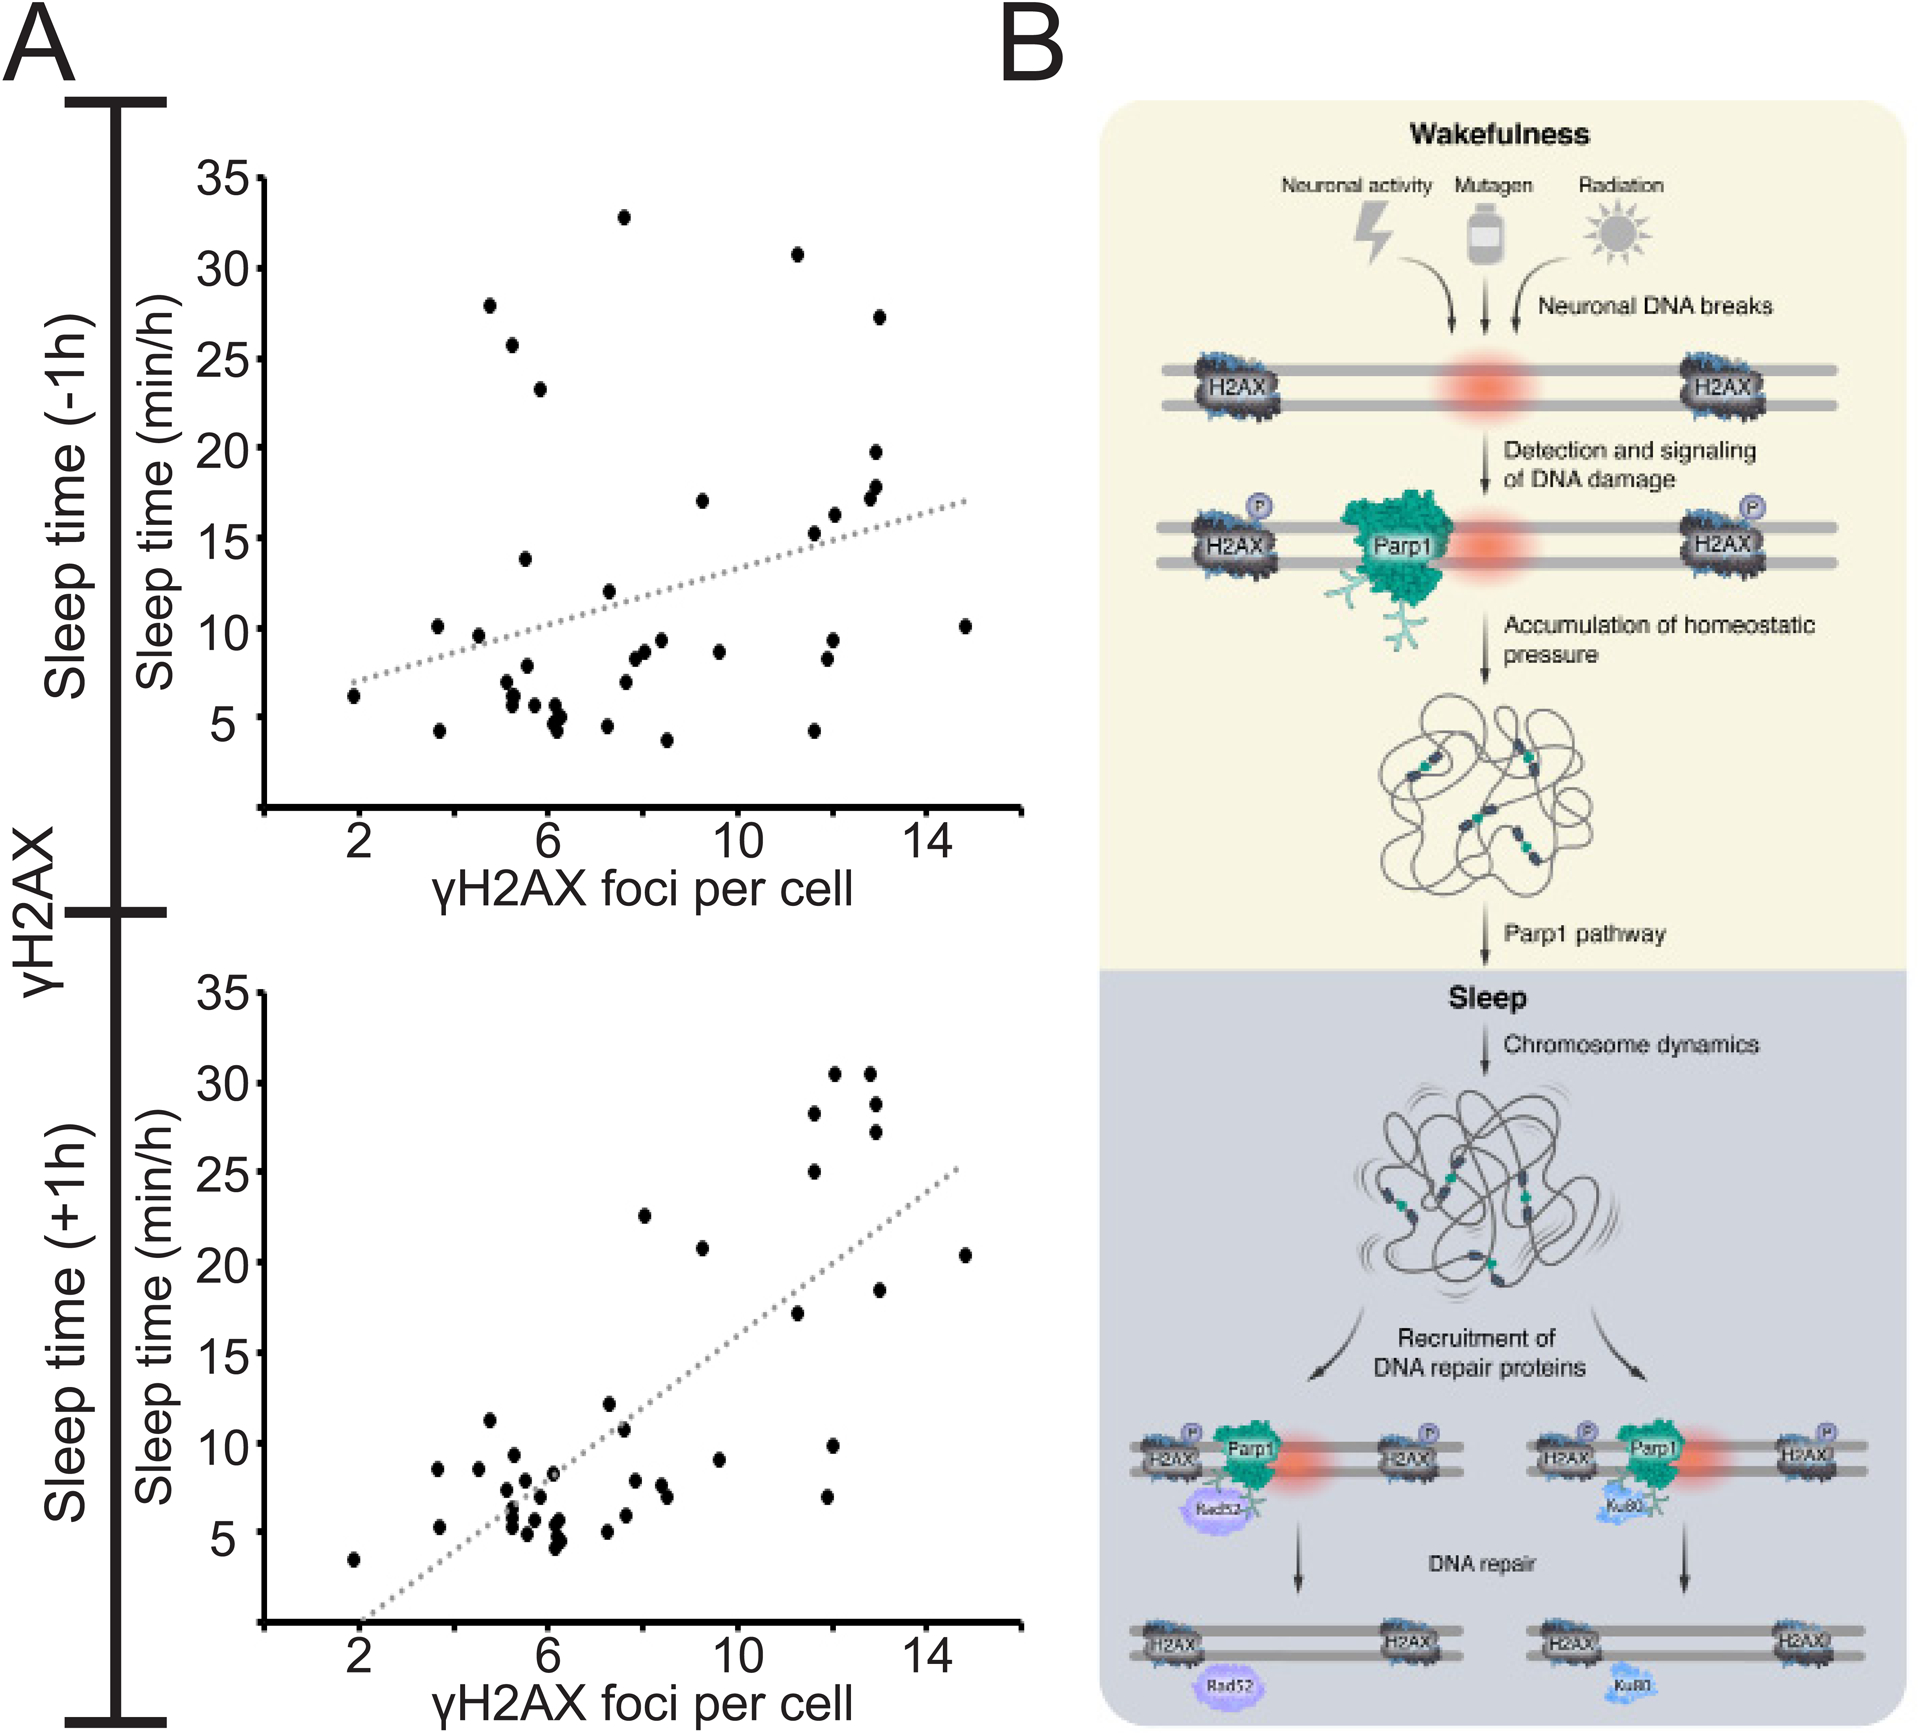
Fig. 6
A. Plots of sleep time and γH2AX foci number (collection of data presented in Figures 1–5). Weak correlation (R = 0.3) between the amount of DNA damage and sleep time prior to the quantification of γH2AX foci (upper graph). Strong positive correlation (R = 0.76) between the amount of DNA damage and sleep time following the quantification of γH2AX foci (lower graph). This correlation suggests that the amount of the homeostatic driver – DNA damage – can predict the requirement of sleep time. Pearson correlation coefficient. B. During wakefulness, various processes, ranging from neuronal activity and radiation to mutagen activity, cause DNA damage in neurons (red circle). The DNA damage detector Parp1 is immediately recruited and activated in DNA loose ends, and soon after, the H2AX histone is phosphorylated (p). The accumulation of DNA damage is a homeostatic driver for sleep, and Parp1 activity and downstream pathways can mediate the signal to sleep. During sleep, chromosome dynamics increase, which enables the recruitment and efficient activity of the repair proteins Rad52 and Ku80 and their repair signaling pathways. Then, Parp1 is deactivated, the number of γH2AX is reduced, and the DNA damage-dependent homeostatic pressure to sleep is relieved. The duration and efficiency of this process may explain species-specific length and quality of sleep and repair (6 h in zebrafish larvae).