
Fig. 3
- ID
- ZDB-FIG-230118-3
- Publication
- Zada et al., 2021 - Parp1 promotes sleep, which enhances DNA repair in neurons
- Other Figures
- All Figure Page
- Back to All Figure Page
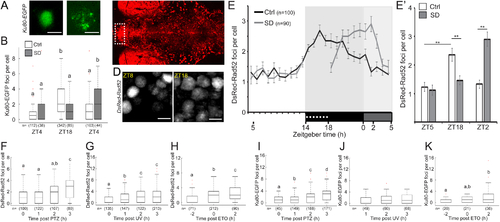
Rad52- and ku80-repair activity is increased during sleep and post induction of DNA damage.
A. Representative images of HuC-driven Ku80-EGFP expression in neuron of 6 dpf larvae during day (ZT4) and night (ZT18). B. Number of Ku80-EGFP foci in single neurons under LD to constant darkness (LDD). p=1.1×10⁻¹⁶. C. Dorsal view of 6 dpf tg(HuC:Gal4/uas:DsRed-Rad52) larvae. Dashed box marks the dorsal pallium (DP). MB- midbrain. D. Representative images of the same DP region of 6 dpf tg(HuC:Gal4/uas:DsRed-Rad52) larvae during day (ZT8) and night (ZT18). E, E’. The number of DsRed-Rad52 foci in single neurons of the DP under LDD. **p < 0.01, two-tailed t-test: two samples assuming unequal variance. F-H. The number of DsRed-Rad52 foci in single nuclei following 30 min of PTZ treatment (F, p = 4.2×10⁻¹²), following 2 min UV exposure (G, p = 1.9×10⁻¹²), and before, immediately after, and following ETO treatment (H, p = 3.3×10⁻⁹). I-K. The number of Ku80-EGFP foci in single nuclei following 30 min of PTZ treatment (I, p = 3.6×10⁻¹³), following 2 min UV exposure (J), and before, immediately after, and following ETO treatment (K, p = 0.03). Data show mean ± SEM (B, E, E’), or boxplots (F-K). Red crosses indicate outliers. Letters indicate significant differences (p < 0.05), one-way (F-K) or two-way (B, E’) ANOVA followed by Tukey’s test. n-number of cells. ZT–zeitgeber time. Scale bar = 5 μm. |