
|
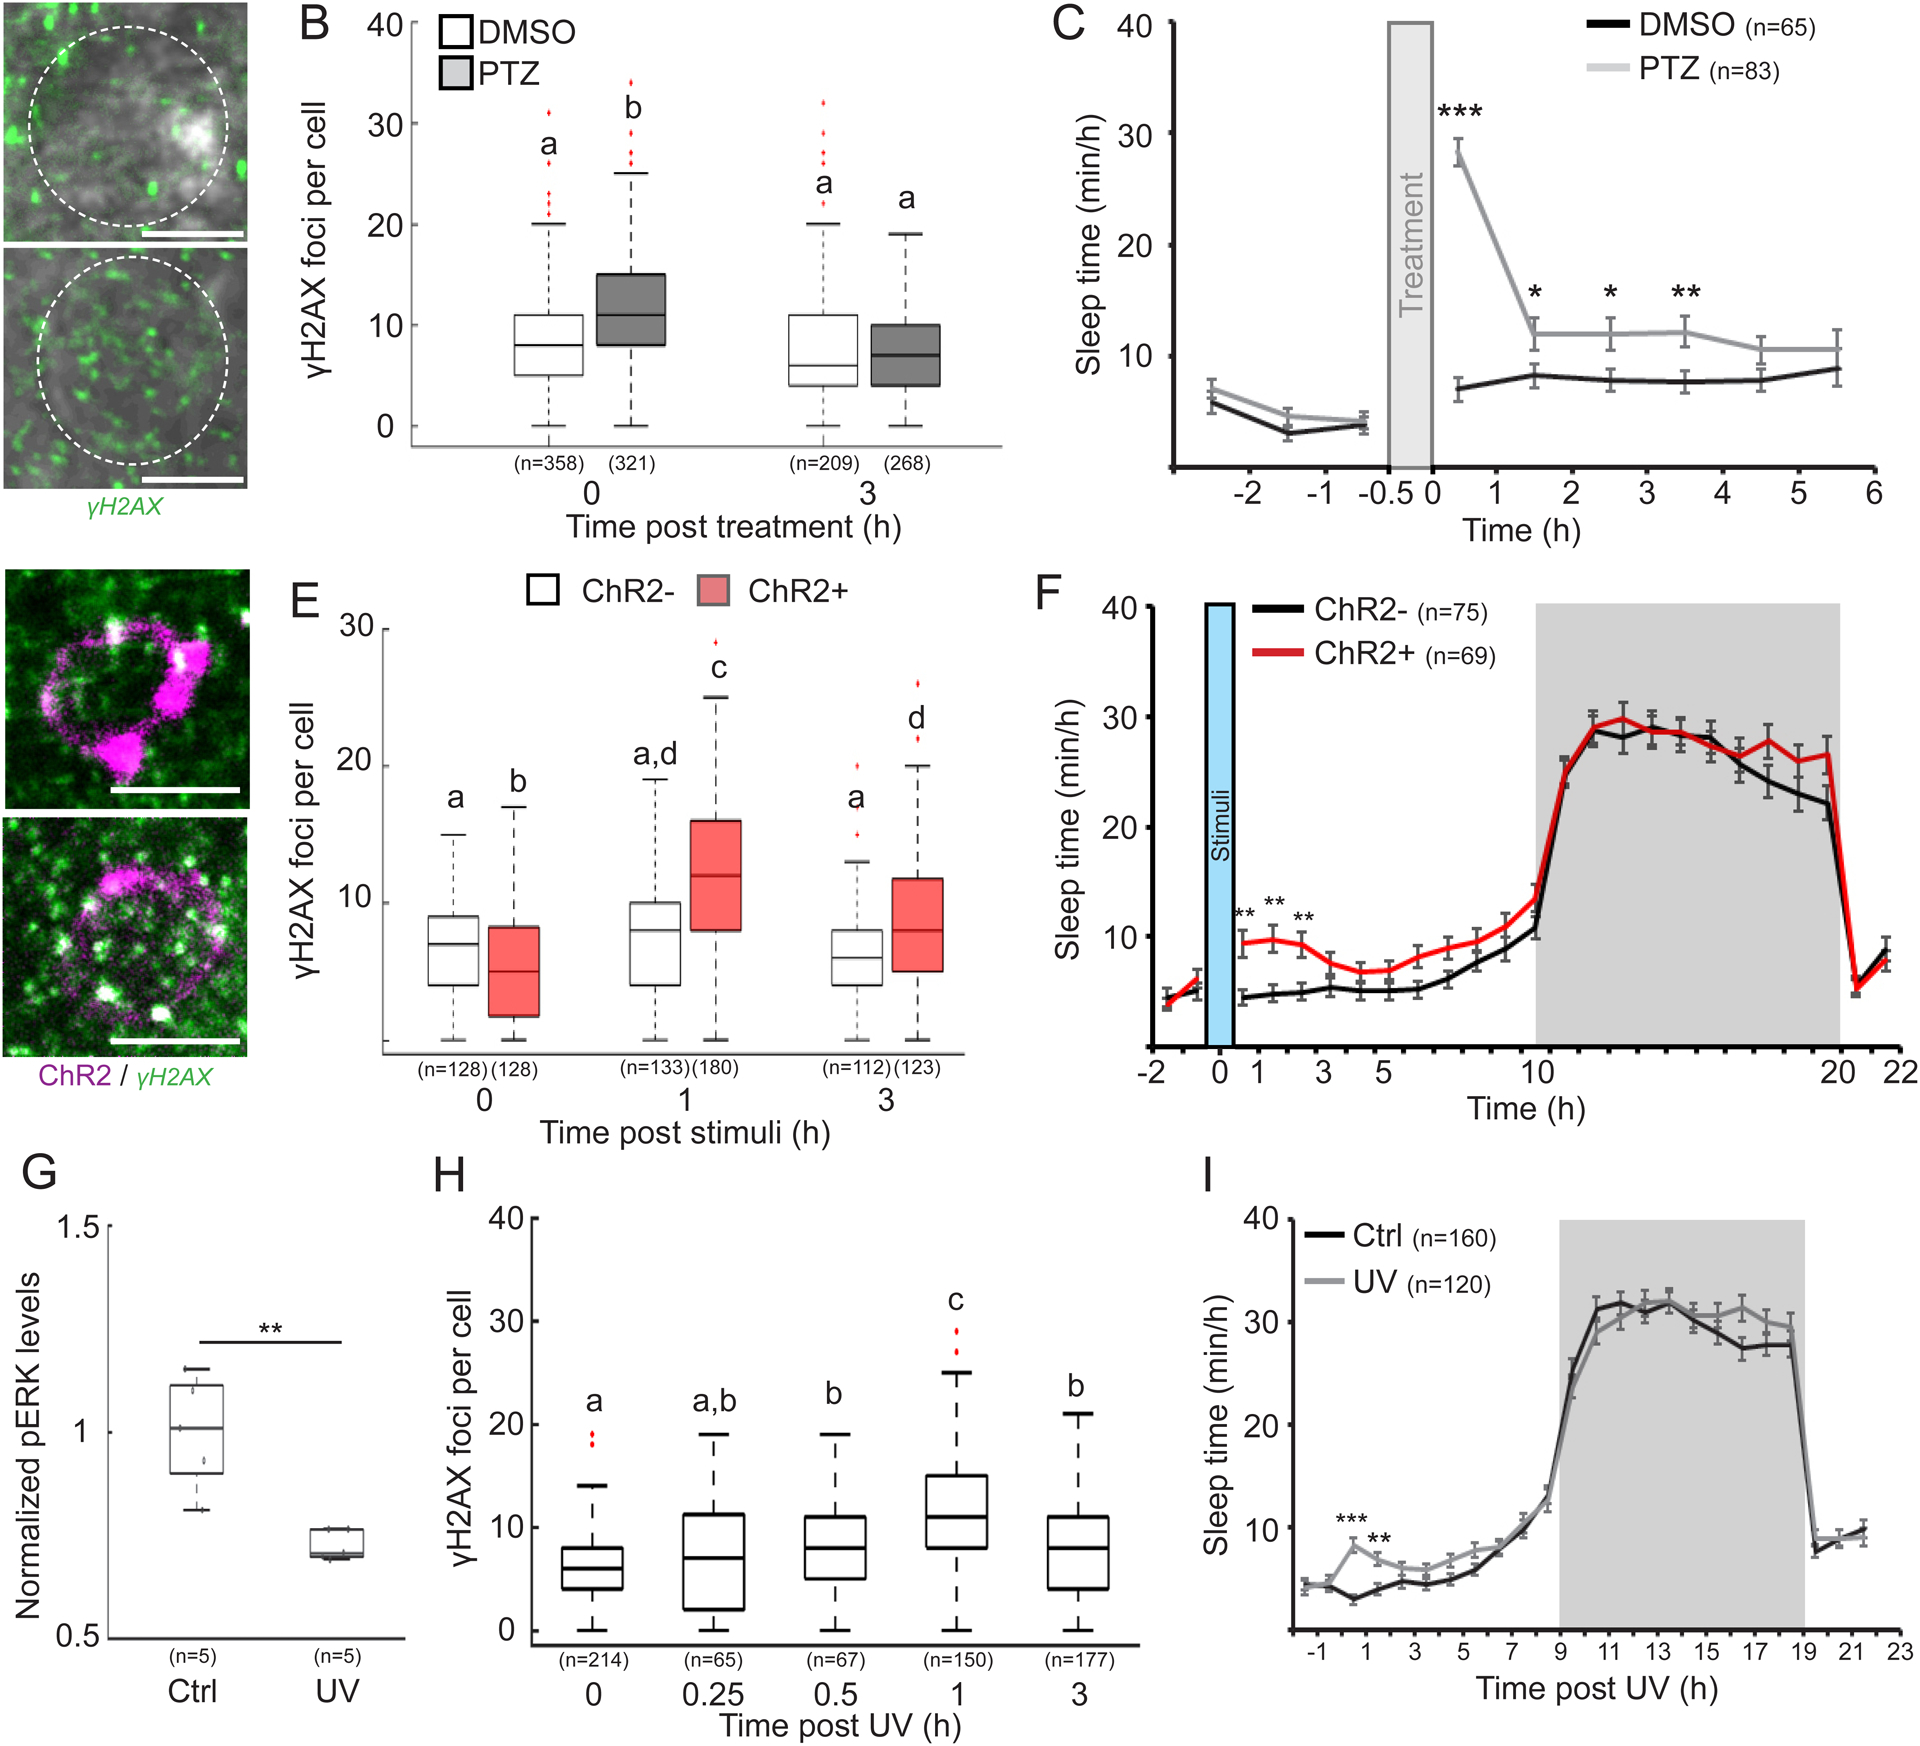
Fig. 2
A. Representative images of γH2AX staining in neurons of the DP region of 6 dpf larvae immediately following 30 min of DMSO or PTZ treatment. Dashed circle indicates a single neuron. B. The levels of DNA damage in single nuclei immediately (0) and 3 h following DMSO or PTZ treatment. p = 1.3×10⁻⁹. C. Sleep before and after PTZ treatment in 6 dpf larvae. D. Representative images of γH2AX staining (green) in the DP region of tg(HuC:Gal4/uas:ChR2-mCherry) 6 dpf larvae expressing ChR2-mCherry (magenta) immediately and 1 h following 10 min of blue light stimuli. E. The levels of DNA damage in single neuronal nuclei. p = 2×10⁻²⁰. F. Sleep before and after 10 min of blue light stimuli in 6 dpf tg(HuC:Gal4)/tg(uas:ChR2-mCherry) (ChR2−) and tg(HuC:Gal4/uas:ChR2-mCherry) (ChR2+) larvae. G. Levels of α-pERK in the DP of 6 dpf larvae following 2 min exposure to purple (Ctrl) or UV light. H. The levels of DNA damage in single nuclei following 2 min UV exposure. p = 4.4×10⁻²⁸. I. Sleep prior and post 2 min exposure to ctrl or UV light. Data show mean ± SEM (C, F, I), or boxplots (B, E, G, H). Red crosses indicate outliers. *p < 0.05, **p < 0.01, ***p < 0.001. Letters indicate significant differences (p < 0.05), two-tailed t-test: two samples assuming unequal variance (C, F, G, I), one-way (H) or two-way (B, E) ANOVA followed by Tukey’s test. n=number of animals (C, F, G, I) or cells (B, E, H). Scale bar = 5 μm.