
- Title
-
RAG2 abolishes RAG1 aggregation to facilitate V(D)J recombination
- Authors
- Gan, T., Wang, Y., Liu, Y., Schatz, D.G., Hu, J.
- Source
- Full text @ Cell Rep.
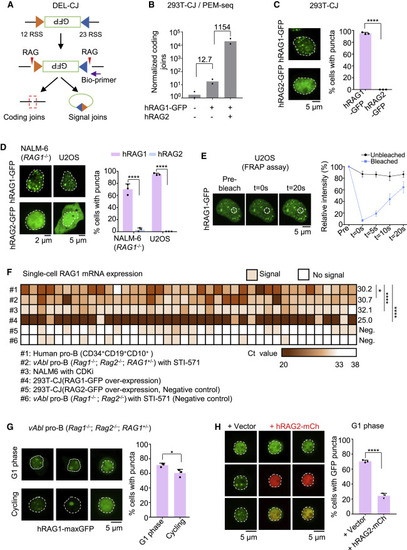
Figure 1. RAG1 undergoes aggregation in lymphocytes and nonlymphoid cells (A) Integration of bona fide 12 and 23 RSS pairs in HEK293T cells (293T-CJ), which can be recognized and cleaved by the RAG complex. Purple arrow indicates the position of the bio-primer for PEM-seq. Red triangles indicate the RAG complex. Green box indicates the inverted GFP segment. (B) Coding joins detected by the PEM-seq in 293T-CJ cells. Numbers of coding joins were normalized to total mapping reads including uncut and deletional coding joins. Fold changes are indicated. Replicates n = 2. (C) Representative microscopy images of indicated proteins in 293T-CJ cells (left). Bar graph (right) shows the percentage of cells with puncta in the total observed cells; replicates n = 3; t test; ∗∗∗∗p < 0.0001. Scale bar: 2 μm (left) and 5 μm (right). (D) Representative microscopy images of hRAG1-GFP in NALM-6 (RAG1−/−) and U2OS cells. Percentages on the right; replicates n = 3; t test; ∗∗∗∗p < 0.0001. Scale bar: 5 μm. (E) Representative images of hRAG1-GFP in U2OS cells for FRAP (fluorescence recovery after photobleaching) experiment. The dashed line indicates the circled bleached dots. Bleaching occurred at t = 0 s, and recovered intensity was detected at t = 20 s (left). Intensity recovery lines for hRAG1-GFP puncta are shown on the right. The background-subtracted fluorescence intensities are normalized by pre-bleach values. Cell number n = 15. Scale bar: 5 μm. (F) Heatmap showing RAG1 gene expression patterns across individual human pro-B cells or other types of cells in Figure S2D. The mRNA of RAG1 at single-cell level was quantified using the single-cell qPCR, and the Ct values were presented as color gradation. The average of Ct was marked for each sample. Cell number n = 40; t test; ∗p < 0.05; ∗∗∗∗p < 0.0001; Neg., negative control. (G) Representative microscopy images of hRAG1-maxGFP in vAbl (Rag1−/−; Rag2−/−; RAG1+/−) cells at cycling or G1 phase (left). Bar graph shows the percentage of cells with puncta (right); replicates n = 3; t test; ∗p < 0.05. Scale bar: 5 μm. (H) Representative microscopy images of hRAG1-maxGFP with overexpressed hRAG2-mCherry in vAbl pro-B (Rag1−/−; Rag2−/−; RAG1+/−) cells at G1 phase (left). Bar graph (right) shows the percentage of cells with puncta; replicates n = 3; t test; ∗∗∗∗p < 0.0001. Scale bar: 5 μm. All error bars represent mean ± SD. See also Figures S1 and S2. |
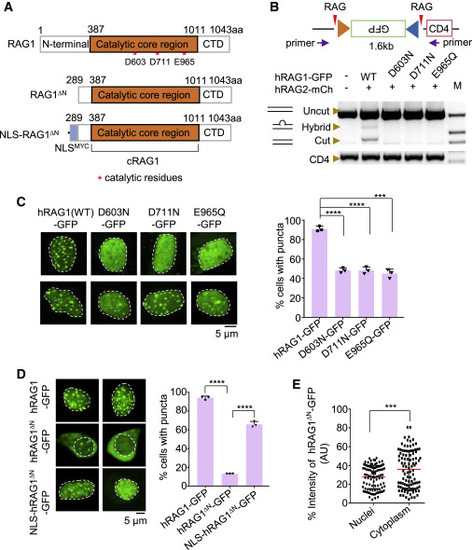
Figure 2. RAG1 aggregates rely on its nuclease activity and nuclear localization (A) Schematic diagram of RAG1, RAG1ΔN, and NLS-RAG1ΔN fusion proteins. (B) The point mutation at the DDE motif of RAG1 hardly supports the recombination of RSSs. PCR was used to quantify the deletional events between 12 RSS and 23 RSS. The purple arrows indicate the primers used for PCR amplification. The CD4 segment was used to quantify the input 293T-CJ genomic DNA. “M” indicates the DNA marker. mCh, mCherry. (C) Representative microscopy images of DDE mutants in 293T-CJ cells (left). Bar graph (right) shows the percentage of cells with puncta; replicates n = 3; t test; ∗∗∗∗p < 0.0001; ∗∗∗p < 0.001. Scale bar: 5 μm. (D) Representative microscopy images of RAG1, RAG1ΔN, and NLS-RAG1ΔN in 293T-CJ cells (left), and the bar graph (right) shows the percentage of cells with puncta. Replicates n = 3; t test; ∗∗∗∗p < 0.0001. Scale bar: 5 μm. (E) Distribution of GFP intensity for RAG1ΔN in 293T-CJ cells. t test; ∗∗∗p < 0.001. All error bars represent mean ± SD. See also Figures S3 and S4. |
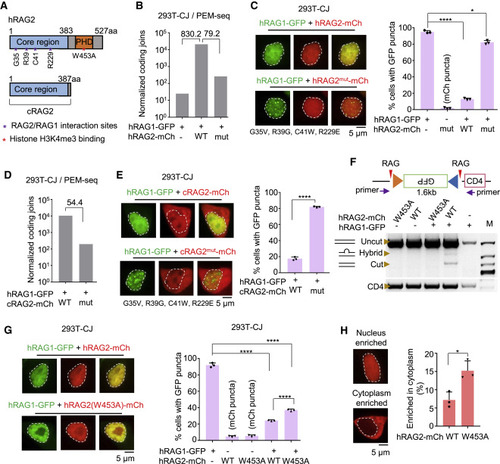
Figure 3. RAG2 abolishes aggregation through direct interaction with RAG1 (A) Schematic diagram of RAG2 and cRAG2. (B) Normalized coding joins detected by PEM-seq in 293T-CJ cells with indicated proteins. Fold changes are indicated. Replicate n = 1. (C) Representative microscopy images of RAG1-GFP coexpressed with mutated RAG2-mCh in 293T-CJ cells. Mutation sites at the interface of RAG2 are indicated. Bar graph shows the percentage of cells with puncta; replicates n = 3; t test; ∗p < 0.05; ∗∗∗∗p < 0.0001. Scale bar: 5 μm. (D) Normalized coding joins detected by the PEM-seq of hRAG1 with cRAG2 or cRAG2mut in 293T-CJ cells. Fold changes are indicated. Replicate n = 1. (E) Representative microscopy images of RAG1-GFP coexpressed with mutated cRAG2-mCh in 293T-CJ cells. Percentages are on the right. Replicates n = 3; t test; ∗∗∗∗p < 0.0001. Scale bar: 5 μm. (F) Quantitation of the catalytic activity of RAG1-GFP coexpressed with indicated forms of RAG2-mCh in 293T-CJ cells by PCR. (G) Representative microscopy images of indicated proteins in 293T-CJ cells. Percentages are on the right. Replicates n = 3; t test; ∗∗∗∗p < 0.0001. Scale bar: 5 μm. (H) Distribution of wild-type or W453A of RAG2-mCh in 293T-CJ cells. Percentages are on the right. Replicates n = 3; t test; ∗p < 0.05. Scale bar: 5 μm. All error bars represent mean ± SD. See also Figure S5. |
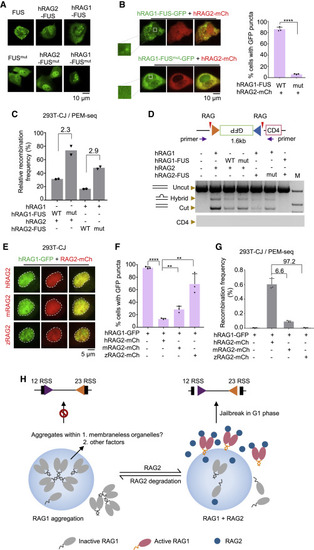
Figure 4. Human RAG2 abolishes the aggregation of human RAG1 to initiate V(D)J recombination (A) Representative microscopy images of indicated proteins or corresponding mutants (bottom) in U2OS cells. Scale bar: 10 μm. (B) Representative microscopy images of indicated proteins coexpressed with RAG2-mCh in U2OS cells. Magnified view of “Boxed regions” shows the RAG1-FUS-GFP puncta in the nucleus. Percentages are on the right. Replicates n = 3; t test; ∗∗∗∗p < 0.0001. Scale bar: 10 μm. (C) Coding joins detected by PEM-seq in 293T-CJ cells with indicated proteins. Fold changes are indicated. Replicates n = 2. (D) Quantitation of the catalytic activity of indicated coexpression of RAG1 and RAG2 fusion proteins in 293T-CJ cells by PCR. (E and F) Representative microscopy images of RAG1-GFP coexpressed with indicated RAG2-mCh in 293T-CJ cells (E) and percentages on the panel (F). Replicates n = 3; t test; ∗∗p < 0.01; ∗∗∗∗p < 0.0001. Scale bar: 5 μm. (G) Recombination frequency mediated by RAG1-GFP with indicated RAG2-mCh detected by PEM-seq. Fold changes are indicated. Replicate n = 3; t test was used for analysis. (H) “Jailbreak” working model of RAG1. When the RAG2 is degraded, the remaining RAG1 proteins aggregated in the nucleus may with the help of other factors or membraneless organelles (left). When cells enter the G1 phase, new RAG2 travels to interact with aggregated RAG1 and releases the RAG1 from aggregation jail to initiate the V(D)J recombination (right). All error bars represent mean ± SD. See also Figure S6. |