
Fig. 2
- ID
- ZDB-FIG-221123-4
- Publication
- Gan et al., 2021 - RAG2 abolishes RAG1 aggregation to facilitate V(D)J recombination
- Other Figures
- All Figure Page
- Back to All Figure Page
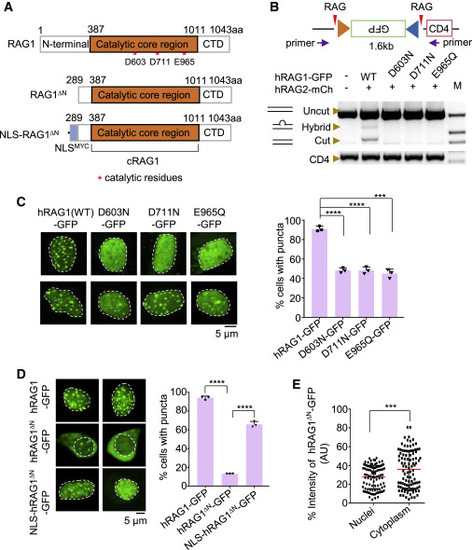
Figure 2. RAG1 aggregates rely on its nuclease activity and nuclear localization (A) Schematic diagram of RAG1, RAG1ΔN, and NLS-RAG1ΔN fusion proteins. (B) The point mutation at the DDE motif of RAG1 hardly supports the recombination of RSSs. PCR was used to quantify the deletional events between 12 RSS and 23 RSS. The purple arrows indicate the primers used for PCR amplification. The CD4 segment was used to quantify the input 293T-CJ genomic DNA. “M” indicates the DNA marker. mCh, mCherry. (C) Representative microscopy images of DDE mutants in 293T-CJ cells (left). Bar graph (right) shows the percentage of cells with puncta; replicates n = 3; t test; ∗∗∗∗p < 0.0001; ∗∗∗p < 0.001. Scale bar: 5 μm. (D) Representative microscopy images of RAG1, RAG1ΔN, and NLS-RAG1ΔN in 293T-CJ cells (left), and the bar graph (right) shows the percentage of cells with puncta. Replicates n = 3; t test; ∗∗∗∗p < 0.0001. Scale bar: 5 μm. (E) Distribution of GFP intensity for RAG1ΔN in 293T-CJ cells. t test; ∗∗∗p < 0.001. All error bars represent mean ± SD. See also Figures S3 and S4. |