
Fig. 3
- ID
- ZDB-FIG-221123-5
- Publication
- Gan et al., 2021 - RAG2 abolishes RAG1 aggregation to facilitate V(D)J recombination
- Other Figures
- All Figure Page
- Back to All Figure Page
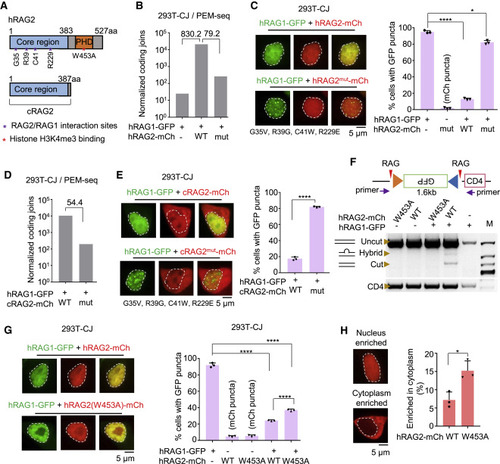
Figure 3. RAG2 abolishes aggregation through direct interaction with RAG1 (A) Schematic diagram of RAG2 and cRAG2. (B) Normalized coding joins detected by PEM-seq in 293T-CJ cells with indicated proteins. Fold changes are indicated. Replicate n = 1. (C) Representative microscopy images of RAG1-GFP coexpressed with mutated RAG2-mCh in 293T-CJ cells. Mutation sites at the interface of RAG2 are indicated. Bar graph shows the percentage of cells with puncta; replicates n = 3; t test; ∗p < 0.05; ∗∗∗∗p < 0.0001. Scale bar: 5 μm. (D) Normalized coding joins detected by the PEM-seq of hRAG1 with cRAG2 or cRAG2mut in 293T-CJ cells. Fold changes are indicated. Replicate n = 1. (E) Representative microscopy images of RAG1-GFP coexpressed with mutated cRAG2-mCh in 293T-CJ cells. Percentages are on the right. Replicates n = 3; t test; ∗∗∗∗p < 0.0001. Scale bar: 5 μm. (F) Quantitation of the catalytic activity of RAG1-GFP coexpressed with indicated forms of RAG2-mCh in 293T-CJ cells by PCR. (G) Representative microscopy images of indicated proteins in 293T-CJ cells. Percentages are on the right. Replicates n = 3; t test; ∗∗∗∗p < 0.0001. Scale bar: 5 μm. (H) Distribution of wild-type or W453A of RAG2-mCh in 293T-CJ cells. Percentages are on the right. Replicates n = 3; t test; ∗p < 0.05. Scale bar: 5 μm. All error bars represent mean ± SD. See also Figure S5. |