
Fig. 4
- ID
- ZDB-IMAGE-221123-6
- Publication
- Gan et al., 2021 - RAG2 abolishes RAG1 aggregation to facilitate V(D)J recombination
- All Figures
- Figures for Gan et al., 2021
|
Fig. 4
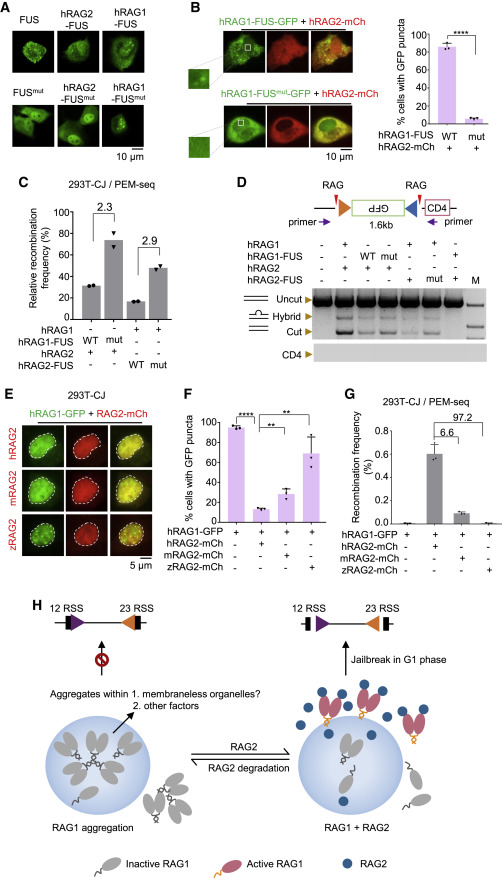
Figure 4. Human RAG2 abolishes the aggregation of human RAG1 to initiate V(D)J recombination (A) Representative microscopy images of indicated proteins or corresponding mutants (bottom) in U2OS cells. Scale bar: 10 μm. (B) Representative microscopy images of indicated proteins coexpressed with RAG2-mCh in U2OS cells. Magnified view of “Boxed regions” shows the RAG1-FUS-GFP puncta in the nucleus. Percentages are on the right. Replicates n = 3; t test; ∗∗∗∗p < 0.0001. Scale bar: 10 μm. (C) Coding joins detected by PEM-seq in 293T-CJ cells with indicated proteins. Fold changes are indicated. Replicates n = 2. (D) Quantitation of the catalytic activity of indicated coexpression of RAG1 and RAG2 fusion proteins in 293T-CJ cells by PCR. (E and F) Representative microscopy images of RAG1-GFP coexpressed with indicated RAG2-mCh in 293T-CJ cells (E) and percentages on the panel (F). Replicates n = 3; t test; ∗∗p < 0.01; ∗∗∗∗p < 0.0001. Scale bar: 5 μm. (G) Recombination frequency mediated by RAG1-GFP with indicated RAG2-mCh detected by PEM-seq. Fold changes are indicated. Replicate n = 3; t test was used for analysis. (H) “Jailbreak” working model of RAG1. When the RAG2 is degraded, the remaining RAG1 proteins aggregated in the nucleus may with the help of other factors or membraneless organelles (left). When cells enter the G1 phase, new RAG2 travels to interact with aggregated RAG1 and releases the RAG1 from aggregation jail to initiate the V(D)J recombination (right). All error bars represent mean ± SD. See also Figure S6.