
|
Fig. 1
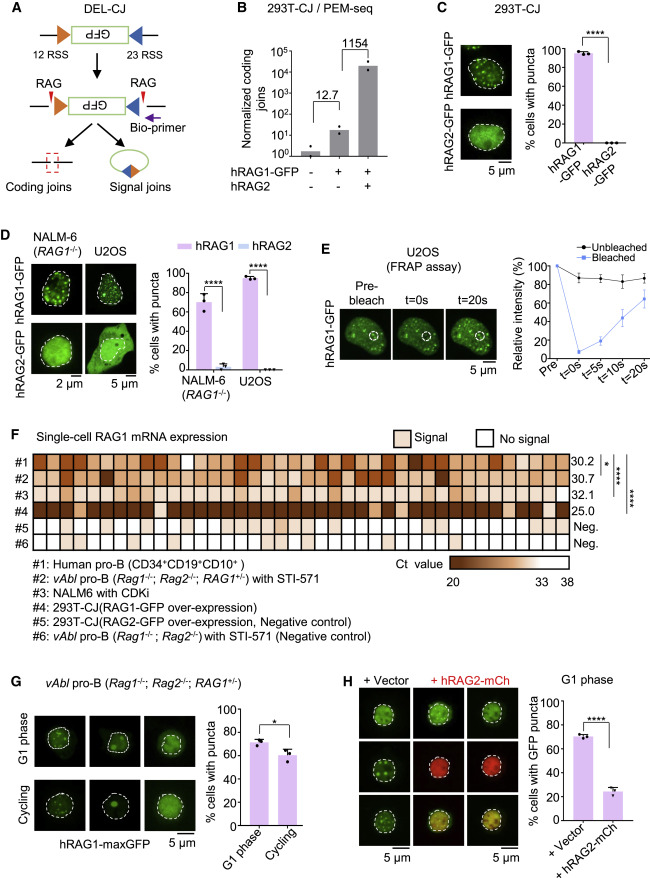
Figure 1. RAG1 undergoes aggregation in lymphocytes and nonlymphoid cells (A) Integration of bona fide 12 and 23 RSS pairs in HEK293T cells (293T-CJ), which can be recognized and cleaved by the RAG complex. Purple arrow indicates the position of the bio-primer for PEM-seq. Red triangles indicate the RAG complex. Green box indicates the inverted GFP segment. (B) Coding joins detected by the PEM-seq in 293T-CJ cells. Numbers of coding joins were normalized to total mapping reads including uncut and deletional coding joins. Fold changes are indicated. Replicates n = 2. (C) Representative microscopy images of indicated proteins in 293T-CJ cells (left). Bar graph (right) shows the percentage of cells with puncta in the total observed cells; replicates n = 3; t test; ∗∗∗∗p < 0.0001. Scale bar: 2 μm (left) and 5 μm (right). (D) Representative microscopy images of hRAG1-GFP in NALM-6 (RAG1−/−) and U2OS cells. Percentages on the right; replicates n = 3; t test; ∗∗∗∗p < 0.0001. Scale bar: 5 μm. (E) Representative images of hRAG1-GFP in U2OS cells for FRAP (fluorescence recovery after photobleaching) experiment. The dashed line indicates the circled bleached dots. Bleaching occurred at t = 0 s, and recovered intensity was detected at t = 20 s (left). Intensity recovery lines for hRAG1-GFP puncta are shown on the right. The background-subtracted fluorescence intensities are normalized by pre-bleach values. Cell number n = 15. Scale bar: 5 μm. (F) Heatmap showing RAG1 gene expression patterns across individual human pro-B cells or other types of cells in Figure S2D. The mRNA of RAG1 at single-cell level was quantified using the single-cell qPCR, and the Ct values were presented as color gradation. The average of Ct was marked for each sample. Cell number n = 40; t test; ∗p < 0.05; ∗∗∗∗p < 0.0001; Neg., negative control. (G) Representative microscopy images of hRAG1-maxGFP in vAbl (Rag1−/−; Rag2−/−; RAG1+/−) cells at cycling or G1 phase (left). Bar graph shows the percentage of cells with puncta (right); replicates n = 3; t test; ∗p < 0.05. Scale bar: 5 μm. (H) Representative microscopy images of hRAG1-maxGFP with overexpressed hRAG2-mCherry in vAbl pro-B (Rag1−/−; Rag2−/−; RAG1+/−) cells at G1 phase (left). Bar graph (right) shows the percentage of cells with puncta; replicates n = 3; t test; ∗∗∗∗p < 0.0001. Scale bar: 5 μm. All error bars represent mean ± SD. See also Figures S1 and S2.