
- Title
-
A Dominant Heterozygous Mutation in COG4 Causes Saul-Wilson Syndrome, a Primordial Dwarfism, and Disrupts Zebrafish Development via Wnt Signaling
- Authors
- Xia, Z.J., Zeng, X.I., Tambe, M., Ng, B.G., Dong, P.D.S., Freeze, H.H.
- Source
- Full text @ Front Cell Dev Biol
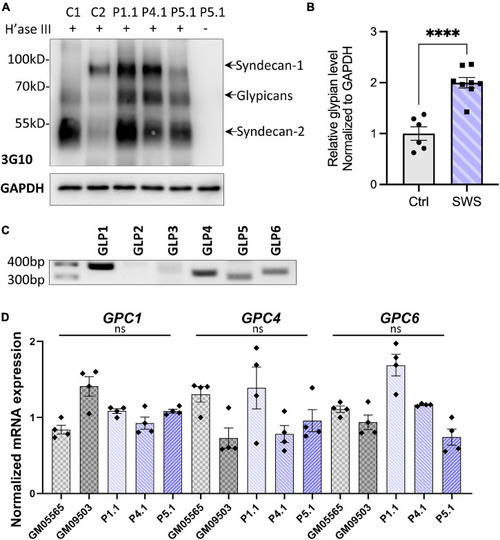
SWS-derived fibroblasts show altered HSPGs and glypicans after heparinase III (H’ase III) digestion. |
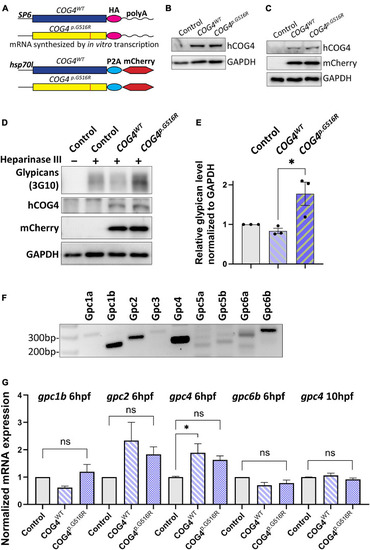
Expression of human |
Expression of human |
Expression of human |
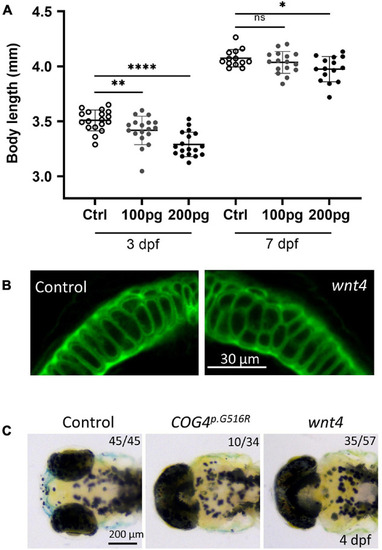
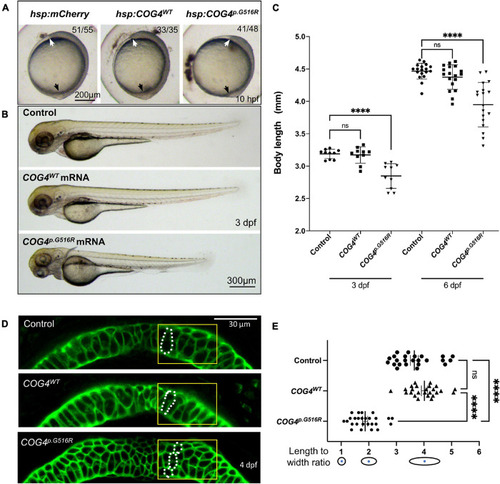
Overexpression of |
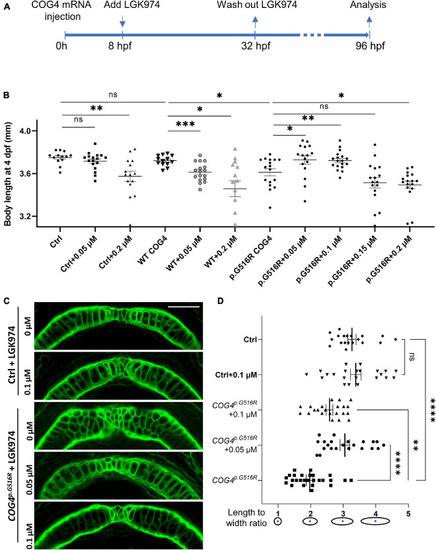
LGK974 treatment suppresses shortened body length and chondrocyte defect caused by of |
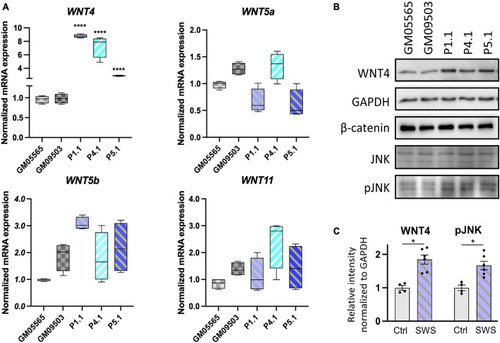
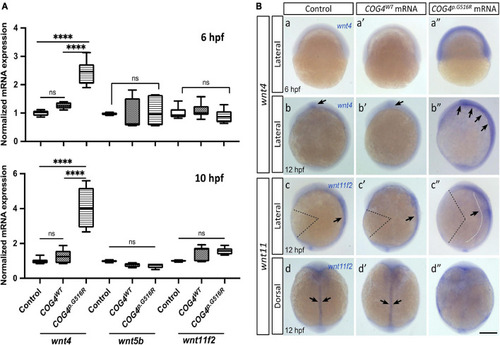
Non-canonical WNTs and related component level in SWS-derived cells. |