FIGURE SUMMARY
Title

A long isoform of GIV/Girdin contains a PDZ-binding module that regulates localization and G-protein binding

Authors
Ear, J., Abd El-Hafeez, A.A., Roy, S., Ngo, T., Rajapakse, N., Choi, J., Khandelwal, S., Ghassemian, M., McCaffrey, L., Kufareva, I., Sahoo, D., Ghosh, P.
Source
Full text @ J. Biol. Chem.

The C terminus of GIV has an evolutionarily conserved functional PDZ-binding motif downstream of its G-protein binding and/or modulatory domains.A, schematic depicting the major modules and motifs within GIV and Daple across different species. B, whole-mount RNA in situ hybridization of the CCDC88 gene family in developing zebrafish embryos across multiple time points. Inset shows anterior or dorsal view of select embryos. Scale bar = 1 mm. C, GST-pull-down assays were carried out using purified rat Gαi3 (loaded with GDP or GDP-AlF4) and lysates of HEK293T cells exogenous expressing zebrafish GIV-CT or Daple-CT. Bound proteins were analyzed (right) and equal loading of lysates was confirmed (left) by immunoblotting (IB). Arrows point to EGFP-zGIV-CT or EGFP-Daple-CT. D, GST-pull-down assays were carried out using purified GST-tagged PDZ domains of ParD3 and Dvl and lysates of HEK293T cells exogenous expressing zebrafish GIV-CT or Daple-CT and bound proteins were visualized as in C. GEM, guanine nucleotide-exchange modulator; GIV-L, long isoform of GIV; HOOK, a highly conserved microtubule-binding N-terminal domain; PBM, PDZ-binding motif.

GIV-L, a human transcript for GIV, translates a variant protein that contains a PBM.A, schematic of GIV and GIV-L transcript as annotated in ensembl. Indicated in red is region where transcript sequence of GIV (Exon 31) and GIV-L diverges. The panel below shows nucleotide sequence and translated sequence of indicated region. B, MeRIP-Seq analysis of GIV transcript as annotated in MeT-DB (http://compgenomics.utsa.edu/methylation/) to map degree of m6A-methylated RNA. Highlighted in red is the corresponding region of GIV-L transcript (the intron immediately downstream of exon 31) indicating the methylated region. C, reverse-transcription PCR of GIV and GIV-L transcript in multiple cell lines: DLD1 E-type and R-type (top), HCT116 (middle, left), Caco-2 (middle, right), and HeLa (bottom).

Both GIV and GIV-L use their GEM motifs to preferentially bind GDP-bound Gαi, but only GIV WT nor other GIV variants, to reduce basal Gαi-RLuc2/mVenus-Gbg BRET in HEK293T cells.A, a schematic displaying the modular makeup of the CCDC88 family of proteins, from top to bottom—CCDC88A/GIV, CCDC88B/Gipie, and CCDC88C/Daple. B, equal aliquots of lysates of HEK293T cells coexpressing FLAG-tagged Gαi3 and either myc-tagged GIV or GIV-L constructs were subjected to immunoprecipitation assays using an anti-FLAG antibody. Bound proteins and cell lysates were assessed for Gαi3 (FLAG) and GIV (myc) by immunoblotting (IB). C, GST-pull-down assays were carried out using purified GST-Gαi3 and lysates of HEK293T cells exogenous expressing myc-tagged wild-type (WT) or F1685A mutant (FA) of human GIV or GIV-L. Bound GIV was analyzed by immunoblotting (IB) using an anti-myc antibody. Panel C′ shows expression of proteins in the HEK293T cell lysates that were used as source of GIV in pull-down assays. D, GST-pull-down assays were carried out using purified GST-Gαi3, preloaded with GDP or GDP-AlF4, and lysates of HEK293T cells exogenously expressing myc-tagged wild-type human GIV or GIV-L. Panel D’′shows expression of proteins in the HEK293T cell lysates that were used as source of GIV in pull-down assays. E, a schematic representation of the Gαi1(91)-RLuc2/mVenus-Gβγ BRET experiment. In the Gαiβγ heterotrimer, the proximity of RLuc2 (fused to Gαi1) to mVenus (fused to Gβγ) generates higher energy transfer (BRET); reduced BRET indicates the dissociation of Gαi1(91)-RLuc2 from mVenus-Gβγ. F, change in basal Gαi1(91)-RLuc2/mVenus-Gβγ BRET in HEK293T cells transfected with the indicated GIV-WT or GEM-deficient F1685A (‘FA’) mutants in the same experiment. The average BRET was calculated over 3 min after adding the Rluc2 substrate, Coelenterazine-h, and the corresponding value from GIV-FA (inactive) cells was subtracted. The experiment was performed in three independent biological replicates on different days, each containing three technical replicates. Error bars represent SEM (n = 3 biological replicates). The graphs were plotted using GraphPad Prism 5 and statistical significance was calculated using Mann–Whitney paired t-test.

The PBM motif in GIV-L binds to multiple PDZ proteins and enhances G-protein binding.A, schematic depicts the similarities between the sequences of the C-terminal PBMs (highlighted in red) of Daple and GIV-L and their respective immediate N-terminal flanking regions. While Daple's PBM is known to bind ParD3 and Dvl, whether GIV-L can bind is tested here. B, equal aliquots of lysates of HEK293T cells coexpressing various FLAG-tagged ParD3 constructs and GIV-L (wt) were subjected to immunoprecipitation assays using an anti-FLAG antibody. Bound proteins (left) and cell lysates (right) were assessed for ParD3 (FLAG) and GIV (myc) by immunoblotting (IB). C, equal aliquots of lysates of HEK293T cells coexpressing untagged Dvl1 and either myc-tagged GIV (wt) or GIV-L (wt or ΔPBM) were subjected to immunoprecipitation assays using an anti-myc antibody. Bound proteins (left) and cell lysates (right) were assessed for Dvl and GIV (myc) by immunoblotting (IB). D, equal aliquots of lysates of HEK293T cells coexpressing FLAG-tagged Gαi3 and either myc-tagged GIV (wt) or GIV-L (wt or ΔPBM) were subjected to immunoprecipitation assays using an anti-FLAG antibody. Bound proteins (top) and cell lysates (bottom) were assessed for Gαi3 (FLAG), GIV (myc), and endogenous Dvl by immunoblotting (IB). E, equal aliquots of lysates of HEK293T cells coexpressing untagged Dvl and either GST or GST-tagged GIV-L (CT) was incubated with glutathione agarose beads. Bound proteins (left) and cell lysates (right) were assessed for Gαi3, Dvl, or GST by immunoblotting (IB). F, schematic summarizing the differential impacts of binding of PDZ proteins to the C-terminal PBM motifs in Daple (left, middle) and GIV-L (right) on their ability to bind Gαi protein.

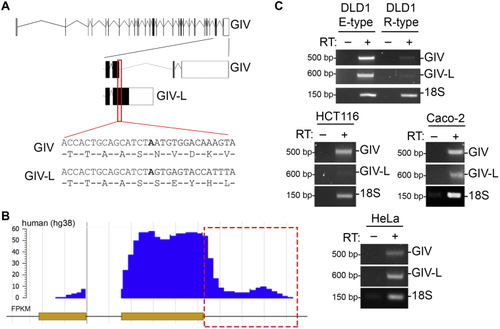
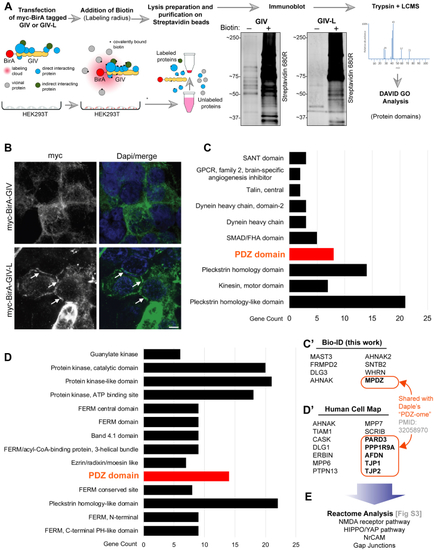
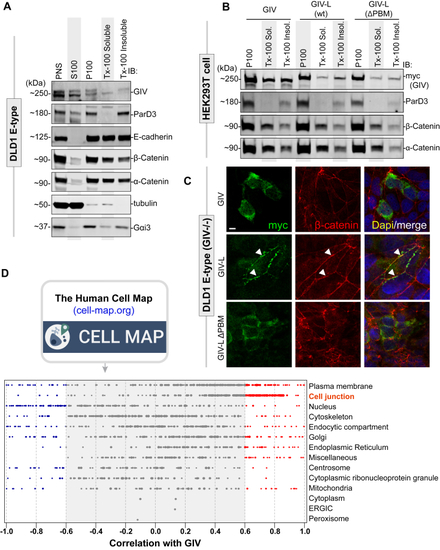
GIV-L, but not GIV, localizes at cell–cell junctions and its PBM is required for such localization.A, DLD1 E-type cells (parental or GIV-knockout) were fractionated into post nuclear supernatant (PNS), cytosolic (S100), crude membrane (P100), membrane detergent soluble (Tx-100 Soluble), and membrane detergent insoluble (Tx-100 Insoluble) pools. Equal proportions of each fraction were assessed for GIV by immunoblotting (IB). Equal loading and reasonable purity (lack of significant cross-contamination) of fractions were confirmed by immunoblotting for ParD3, E-cadherin, β-Catenin, α-Catenin, tubulin, and Gαi3. B, cell fractionation studies were carried out as in (A) on HEK293T cells exogenously expressing myc-tagged GIV, GIV-L (wt), or mutant GIV-L (ΔPBM). Equal proportion of each fraction was assessed for GIV and other loading and/or fractionation controls (as above) by immunoblotting (IB). C, DLD1 E-type cells were transfected with myc-tagged GIV, GIV-L (wt), or mutant GIV-L (ΔPBM), methanol fixed, and stained with anti-myc (green) or anti-β-Catenin antibody. Arrowheads indicate cell–cell contact sites. Scale bar, 7.5 μm. D, the publicly available BioID-based proximity map of HEK293T cells annotated in the Human Cell Map (HCM) was queried for GIV (without distinguishing GIV and GIV-L) and other preys that cotraffic and localize and functionally associate with GIV (i.e., prey–prey correlations) for various organelle-specific baits. The interactome is enriched for cell-junction-localized proteins.

A protein–protein interaction (BioID) screen identifies the PDZ-interactome of GIV-L.A, schematic depicting the key steps in biotin proximity labeling (BioID) studies used to identify the GIV and GIV-L interactomes in HEK293T cells. HEK293T cells were transiently transfected with myc-BirA tagged GIV or GIV-L construct and then treated with free biotin. Equal aliquots of cell lysates were incubated with streptavidin magnetic beads and proteins were eluted by boiling in the presence of excess free biotin. Eluted proteins were analyzed by SDS-PAGE and blotted with AlexaFluor-680-conjugated streptavidin to confirm successful proximity labeling. B, HEK293T cells exogenously expressing myc-BirA-tagged GIV or GIV-L were fixed with methanol prior to staining using anti-myc antibody. Arrows indicate localization onto points of cell–cell contact. Scale bar, 5 μm. C, bar graph summarizing the GIV-L-interacting proteins identified by mass spectrometry and grouped by protein domain using DAVID GO analysis. Top domain categories are shown. C′, list of PDZ domain proteins identified. D, bar graph summarizing GIV's interactome as annotated in the Human Cell map database and also grouped by protein domain using DAVID GO analysis. Top domain categories are shown. Panel D′ lists the PDZ-domain containing proteins reported in the Human Cell Map database.

Depletion of GIV in Caco-2 cells increases anchorage-dependent colony growth, survival, loss of contact-dependent cell-cycle inhibition, and reduced cell death.A, phase contrast microscopy images of Caco-2 cells stably expressing a shScrambled or shGIV construct. Caco-2 cells were cultured and grown in a confluent monolayer state for 10 days. Zoomed-in images of indicated region are shown below. Central “piling up” of cells is frequently observed in the shGIV monolayer (as outlined). B–D, representative images of crystal violet stained colonies, as seen during anchorage-dependent colony growth assays on control (shScrambled) and GIV-depleted (shGIV) Caco-2 cells after 14 days in culture. Scale bar = 10 mm in (B). Light microscopy images of representative colonies in (C) show the dense areas of piled up cells in shGIV Caco-2 colonies (arrowheads). Scale bar = 0.1 mm. Bar graphs (D) show quantification of colonies. Error bars represent SEM; n = 3 (∗) indicates p ≤0.05, as determined by Student's t-test. E, MTT proliferation assay on control (shScrambled) and GIV-depleted (shGIV) Caco-2 cells grown at 50% or 100% confluency. Bar graphs show quantification of absorbance at 590 nm. Error bars represent SEM; n = 3. (∗) indicates p < 0.05, and (∗∗∗) indicates p < 0.001, as determined by Student's t-test. F, cell cycle distribution of control (shScrambled) and GIV-depleted (shGIV) Caco-2 cells grown at 50% or 100% confluency. Bar graphs show % of cells in each phase of the cell cycle. Error bars represent SEM; n = 3. (∗) indicates p < 0.05, (∗∗) indicates p < 0.01, n.s., nonsignificant, as determined by Student's t-test. G and H, representative cytograms (G) of apoptotic and necrotic control (sh Scrambled) and GIV-depleted (shGIV) Caco-2. The lower-right (annexin V+PI cells) and the upper-right (annexin V+PI+ cells) quadrants show early and late apoptotic cells, respectively, while the lower-left (annexin VPI cells) and the upper-left (annexin VPI cells) quadrants represent viable and necrotic cells, respectively. H, bar graphs display the % of apoptotic and necrotic cells in (G). Error bars represent SEM; n = 3. ∗∗p < 0.01, ∗∗∗p < 0.001, as determined by Student's t-test.

GIV-L is preferentially expressed in the surface epithelium of colon crypts and is downregulated in the transformed epithelium in colon polyps.A and B, images representative of patterns of GIV staining, as determined by immunohistochemistry staining on normal healthy human colon (A) and matched adjacent adenoma (B) with various GIV (total and isoform specific) antibodies. See also Figure S3 for validation studies on the antibodies. C, schematic summarizing the observed expression pattern observed in panels A (top) and B (bottom). ↑, ↓ and ↔ indicate upregulation, downregulation, and no discernible changes in expression, respectively. D and E, working model of the opposing roles (D) and patterns of altered expression (E) of GIV and GIV-L isoforms in the colonic epithelium. Cytosolic GIV promotes stemness, growth, survival, and cell migration, whereas cell-junction-localized GIV-L inhibits growth, survival cell cycle, cell death.

Acknowledgments
This image is the copyrighted work of the attributed author or publisher, and ZFIN has permission only to display this image to its users. Additional permissions should be obtained from the applicable author or publisher of the image. Full text @ J. Biol. Chem.