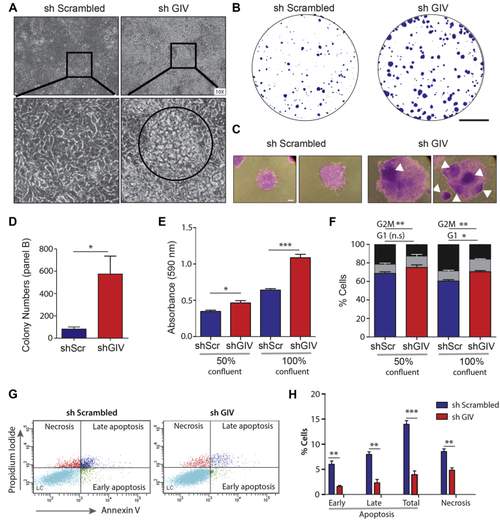
Depletion of GIV in Caco-2 cells increases anchorage-dependent colony growth, survival, loss of contact-dependent cell-cycle inhibition, and reduced cell death.A, phase contrast microscopy images of Caco-2 cells stably expressing a shScrambled or shGIV construct. Caco-2 cells were cultured and grown in a confluent monolayer state for 10 days. Zoomed-in images of indicated region are shown below. Central “piling up” of cells is frequently observed in the shGIV monolayer (as outlined). B–D, representative images of crystal violet stained colonies, as seen during anchorage-dependent colony growth assays on control (shScrambled) and GIV-depleted (shGIV) Caco-2 cells after 14 days in culture. Scale bar = 10 mm in (B). Light microscopy images of representative colonies in (C) show the dense areas of piled up cells in shGIV Caco-2 colonies (arrowheads). Scale bar = 0.1 mm. Bar graphs (D) show quantification of colonies. Error bars represent SEM; n = 3 (∗) indicates p ≤0.05, as determined by Student's t-test. E, MTT proliferation assay on control (shScrambled) and GIV-depleted (shGIV) Caco-2 cells grown at 50% or 100% confluency. Bar graphs show quantification of absorbance at 590 nm. Error bars represent SEM; n = 3. (∗) indicates p < 0.05, and (∗∗∗) indicates p < 0.001, as determined by Student's t-test. F, cell cycle distribution of control (shScrambled) and GIV-depleted (shGIV) Caco-2 cells grown at 50% or 100% confluency. Bar graphs show % of cells in each phase of the cell cycle. Error bars represent SEM; n = 3. (∗) indicates p < 0.05, (∗∗) indicates p < 0.01, n.s., nonsignificant, as determined by Student's t-test. G and H, representative cytograms (G) of apoptotic and necrotic control (sh Scrambled) and GIV-depleted (shGIV) Caco-2. The lower-right (annexin V+PI− cells) and the upper-right (annexin V+PI+ cells) quadrants show early and late apoptotic cells, respectively, while the lower-left (annexin V−PI− cells) and the upper-left (annexin V−PI− cells) quadrants represent viable and necrotic cells, respectively. H, bar graphs display the % of apoptotic and necrotic cells in (G). Error bars represent SEM; n = 3. ∗∗p < 0.01, ∗∗∗p < 0.001, as determined by Student's t-test.
|
